
预测模型Prediction modelNature · 2025 · 647: 248–256
Learning the natural history of human disease with generative transformers
用生成式 Transformer 学习人类疾病的自然史
Delphi-2M 把 GPT 架构用到了健康记录上:它在 402,799 名 UK Biobank 参与者上训练,读取一个人的诊断史,预测 1,256 种疾病和死亡的发生率与发生时间,并能模拟未来的健康轨迹。内部验证的平均 AUC 为 0.76,不重新训练直接用于丹麦 193 万人的登记数据时为 0.67。
Delphi-2M adapts the GPT architecture to health records: trained on 402,799 UK Biobank participants, it reads a person's diagnosis history, predicts the rates and timing of 1,256 diseases plus death, and can simulate future health trajectories. It reached an average AUC of 0.76 internally and 0.67 on 1.93 million Danish registry records without retraining.
方法图解Visual method notes
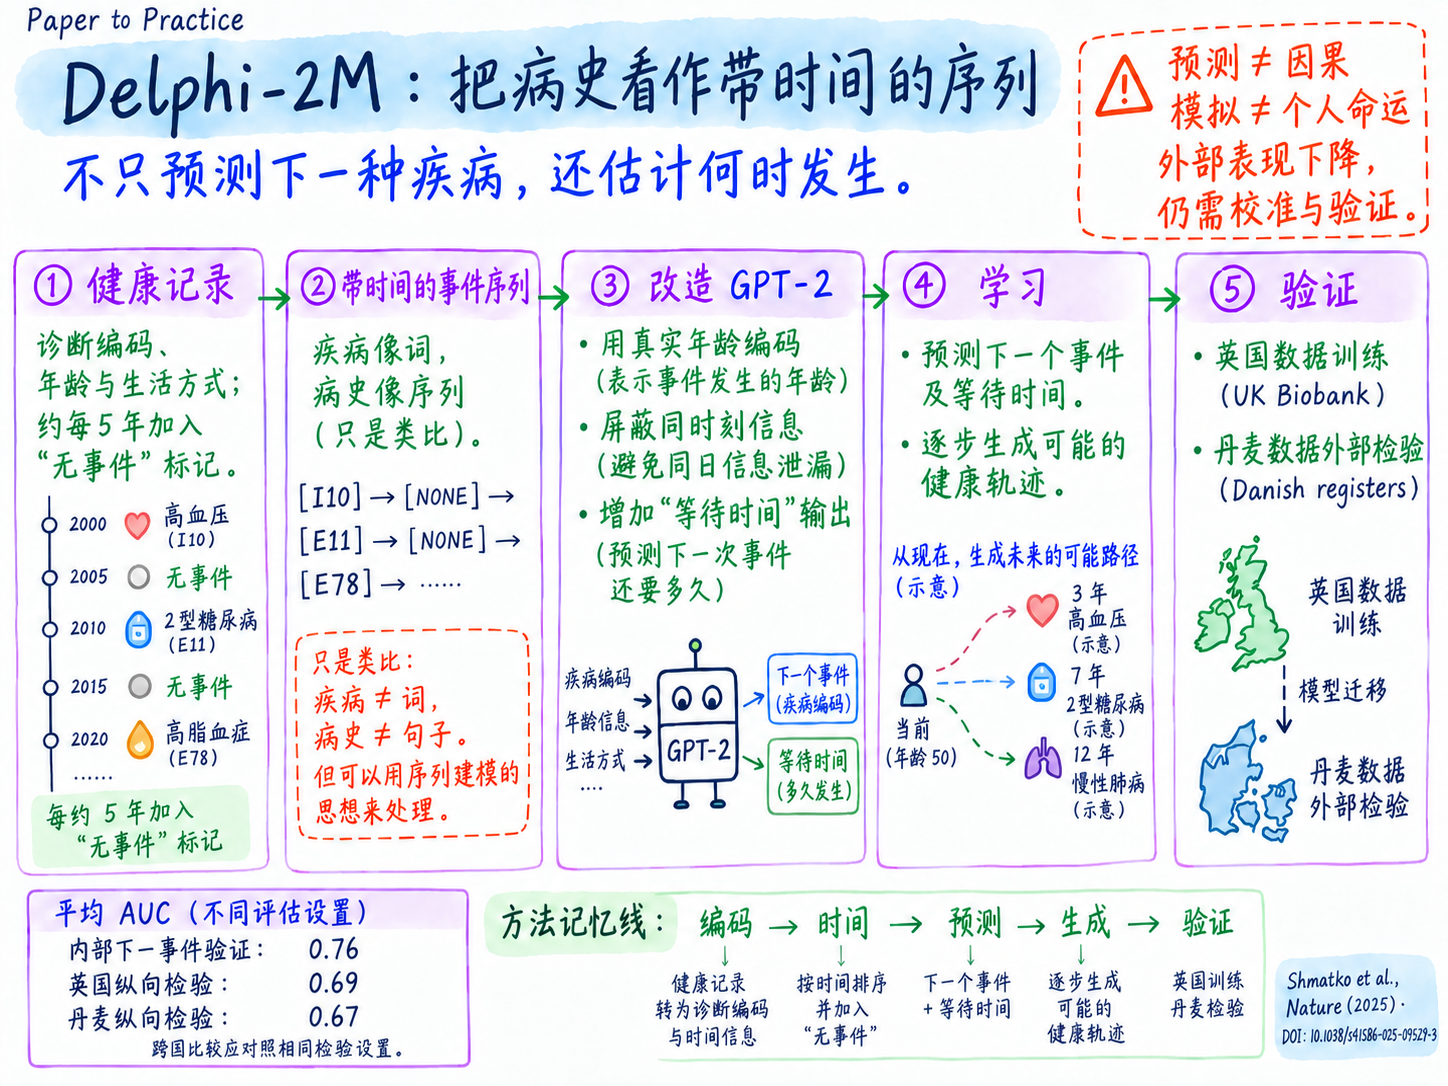
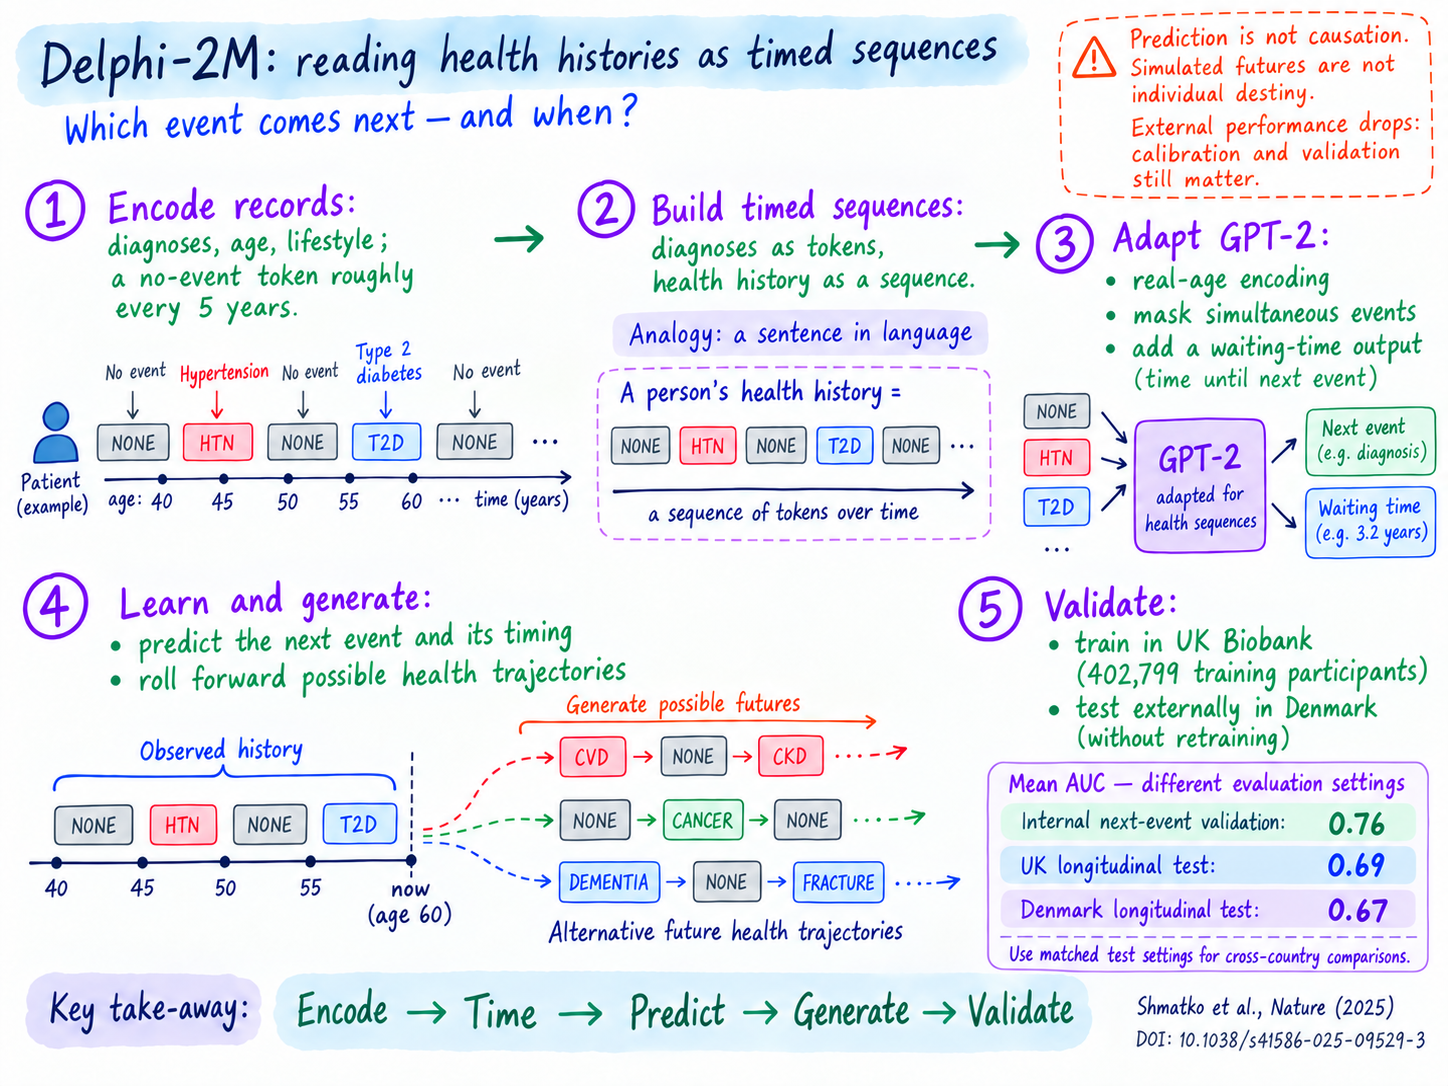
研究背景Background
- 问题Problem
- 医疗决策需要了解个体在整个疾病谱上的风险及其随时间的演变;人口老龄化正在推高多病共存和疾病负担(例如预计到 2050 年全球癌症诊断增加 77%)。Healthcare decisions need individual risk across the full spectrum of disease and its evolution over time, and ageing populations are driving up multimorbidity and disease burden (e.g., a projected 77% rise in global cancer diagnoses by 2050).
- 研究空白Gap
- 现有算法大多只预测单一疾病,很少覆盖 ICD-10 顶层的 1,000 多种诊断;全面的、生成式的多病共存建模尚未在大规模数据上评估过。Existing algorithms mostly predict single diseases; few cover the more than 1,000 top-level ICD-10 diagnoses, and comprehensive generative multimorbidity modelling had not been assessed at scale.
- 研究目标Objective
- 扩展 GPT 来建模终生健康轨迹(Delphi-2M),在 UK Biobank 上训练,不重新训练直接在丹麦登记数据上验证,并考察其准确性、生成能力、可解释性和偏倚。Extend GPT to model lifetime health trajectories (Delphi-2M), train it on UK Biobank, validate it on Danish registries without retraining, and examine its accuracy, generative ability, interpretability and biases.
研究方法Methods
Delphi-2M 想为病史做的事,就像聊天机器人对文字做的事:读完一个人到目前为止的全部经历,估计 1,256 种疾病及死亡中每一种接下来发生的可能性有多大、多快会发生。为此,作者先把每位 UK Biobank 参与者的记录改写成带时间戳的序列,里面是诊断编码、性别和生活方式标记,并大约每 5 年加入一个“无事件”(no event)标记,让健康的时期也被记录下来。接着,他们以文本生成模型 GPT-2(一种 Transformer)为基础,改了三处:用真实年龄取代词的位置;预测某个条目时不许参考同一时刻记录的其他条目;再加一个输出,估计距下一个事件的等待时间。这个拥有 2.2 million(220 万)个可调数字(参数,parameter)的模型,在 402,799 人身上反复练习猜下一个事件及其时间,在留出的 100,639 人身上调整,然后在 UK Biobank 更晚年份的数据上检验,并在不作任何修改的情况下用于 1.93 million(193 万)名丹麦居民,同时与现有临床风险评分比较。最后,由于它能一步一个事件地把病史往前推,作者用它模拟未来病史和完全虚构的合成病史,并借助解释工具查看哪些既往诊断在驱动每次预测,以及数据收集方式带来的偏倚从哪里混了进来。
Delphi-2M tries to do for medical histories what chatbots do for text: read everything that has happened to a person so far and estimate, for each of 1,256 diseases plus death, how likely it is to come next and how soon. To make that possible, the authors first rewrite each UK Biobank participant's record as a time-stamped sequence of diagnosis codes, sex and lifestyle markers, with a 'no event' marker added about every 5 years so that healthy stretches are represented too. They then take GPT-2, a text-generating transformer, and change three things: word position is replaced by real age, the model may not use entries recorded at the same moment as the one it predicts, and a second output estimates the waiting time to the next event. The model, with 2.2 million adjustable numbers (parameters), learns from 402,799 people by repeatedly guessing the next event and its timing, is tuned on 100,639 held-out people, and is then tested on later years of UK Biobank data and, unchanged, on 1.93 million Danish residents, side by side with established clinical risk scores. Finally, because it can roll a history forward one event at a time, it is used to simulate future and entirely synthetic health histories, and explanation tools are applied to see which past diagnoses drive each prediction and where biases from data collection creep in.
研究速览Study at a glance
研究对象Population
UK Biobank 约 500,000 人(2006–2010 年招募时 37–73 岁),用自出生起的记录;训练 402,799 人,验证 100,639 人。外部检验:2016 年 1 月 1 日时 50–80 岁的丹麦居民 1.93 million(193 万)人。
UK Biobank: about 500,000 adults aged 37–73 at 2006–2010 recruitment, with records from birth (402,799 training, 100,639 validation). External test: 1.93 million Danish residents aged 50–80 on 1 January 2016.
数据来源Data source
UK Biobank 首次诊断数据(初级保健、住院、死亡登记、自我报告)及癌症登记,统一为 ICD-10 三位码,另含性别、BMI、吸烟、饮酒。丹麦:国家患者登记与死因登记。
UK Biobank first-occurrence diagnoses (GP, hospital, death and self-report records) plus cancer registry, as ICD-10 level-3 codes, with sex, BMI, smoking and alcohol. Denmark: national patient and cause-of-death registries.
干预 / 暴露Intervention / exposure
待评价模型 Delphi-2M:GPT-2 式 Transformer(2.2 million 参数),加入年龄编码、同时刻注意力屏蔽和等待时间输出;输入为带时间的既往诊断、性别、BMI、吸烟和饮酒序列。
Delphi-2M: a GPT-2-style transformer (2.2 million parameters) with age encoding, same-time attention masking and a waiting-time output, reading timed sequences of past diagnoses, sex, BMI, smoking and alcohol.
对照Comparator
年龄–性别发病率基线(Nelson–Aalen);临床评分(QRisk3、SCORE2、PREVENT、Framingham;UKBDRS;Charlson、Elixhauser);机器学习模型(Transformer、AutoPrognosis v2.0、LLama3.1 8B);MILTON 已发表 AUC;生物标志物与健康自评;标准 GPT 消融。
Age–sex incidence baseline (Nelson–Aalen); clinical scores (QRisk3, SCORE2, PREVENT, Framingham; UKBDRS; Charlson, Elixhauser); machine-learning models (Transformer, AutoPrognosis v2.0, LLama3.1 8B); published MILTON AUCs; biomarkers and self-rated health; standard GPT ablations.
结局指标Outcomes
1,256 种疾病及死亡:下一个是什么、何时发生(每日发生率)。纵向检验:间隔 1 年后 1 年内的新发诊断。以年龄–性别分层 AUC、校准和交叉熵评价。
Which of 1,256 diseases or death comes next, and when (rate per day). Longitudinal tests: new diagnoses in a 1-year window after a 1-year gap. Judged by age–sex-stratified AUC, calibration and cross-entropy.
分析方法Analysis
损失=下一事件交叉熵+指数等待时间似然;AUC 按性别在 5 年年龄段内算(DeLong 置信区间);校准曲线;SHAP、UMAP、Cox、Nelson–Aalen 比较;Bonferroni 校正亚组检验;轨迹模拟。
Training loss: next-event cross-entropy plus exponential waiting-time likelihood; AUC within 5-year age bands by sex (DeLong CIs); calibration curves; SHAP, UMAP, Cox and Nelson–Aalen comparisons; Bonferroni-corrected subgroup tests; simulated trajectories.
场景与时间Setting & period
英国:2006–2010 年招募;训练/验证数据自出生至 2020 年 6 月 30 日;内部检验窗口 2021 年 7 月 1 日至 2022 年 7 月 1 日。丹麦:1978–2016 年记录作输入;外部检验窗口 2017 年 1 月 1 日至 2018 年 1 月 1 日。
UK: recruitment 2006–2010; training/validation data from birth to 30 June 2020; internal test window 1 July 2021–1 July 2022. Denmark: records 1978–2016 as input; external test window 1 January 2017–1 January 2018.
方法分步讲解Step by step
- 1
把病历变成带时间的词元 · Turn records into timed tokens
输入是每位 UK Biobank 参与者的记录:每种诊断首次出现的时间(来自全科医生、住院、癌症登记、死亡登记或自我报告的 1,256 个 ICD-10 编码),以及性别、BMI、吸烟和饮酒。每一项都被变成一个词元(token,即一张固定清单里的一个符号,清单共 1,270 个),并配上记录时以天计的年龄;此外大约每 5 年插入一个“无事件”(no event)词元,让没有生病的平静时期也出现在记录里。输出是每人一份带时间戳的清单,像一本每行写着“45.7 岁:哮喘”的日记;与句子里的词不同,行与行之间隔着真实的时间,而且这个间隔有意义,所以每个词元都带着年龄。由于参与者必须活着才能入组,作者把吸烟、饮酒和 BMI 词元的记录年龄在入组时点前后随机平移(−20 至 +40 年),以免模型把它们和入组后才开始出现的死亡联系起来。The input is each UK Biobank participant's record: the first date of each diagnosis (1,256 ICD-10 codes from GP, hospital, cancer-registry and death records or self-report), plus sex, BMI, smoking and alcohol. Each item becomes a token (one entry from a fixed list of 1,270 symbols) paired with the age in days when it was recorded, and a 'no event' token is slipped in roughly every 5 years so that quiet, healthy stretches also appear in the record. The output is a time-stamped list per person, like a diary whose lines read 'age 45.7: asthma'; unlike words in a sentence, the gaps between lines are real time and carry meaning, which is why the age travels with every token. Because participants had to be alive to join the study, the authors randomly shifted the recorded ages of the smoking, alcohol and BMI tokens (by −20 to +40 years around enrolment) so that the model would not tie them to the deaths that only start to appear after enrolment.为什么这样做Why this stepTransformer 只能读符号序列,所以必须先把一生的诊断整理成这种形式;“无事件”词元则让模型即使在没有任何记录的年份,也能随着年龄增长定期更新风险。A transformer can only read sequences of symbols, so a lifetime of diagnoses has to be put in that form first, and the 'no event' tokens give the model regular moments to update risk as a person ages even when nothing is recorded.技术细节Technical detail · M4, M6, M7, M11, M12, M13, M17, M18, M19, M20每个数据点是一个(词元, 以天计的年龄)对;词表包括 1,257 个 ICD-10 三位码疾病词元(UK Biobank category 1712 的首次发生数据,加上癌症登记字段 40005/40006)、9 个生活方式词元(BMI、吸烟、饮酒各 3 档)、2 个性别词元、1 个“无事件”词元和 1 个不携带信息的填充词元。“无事件”词元按每 5 年 1 个的速率加入:在 (0, 36,525) 天内均匀抽取 20 个时间点,再与每人的数据时间范围取交集;性别词元放在出生时刻,生活方式词元的时间在入组时点前后随机平移 −20 至 +40 年,以打断与永生时间偏倚(immortal time bias)之间的混杂。图 1b 报告 UK Biobank 共 502,485 人、7,426,036 个词元。Each datapoint is a (token, age-in-days) pair; the vocabulary holds 1,257 ICD-10 level-3 disease tokens (first occurrences from UK Biobank category 1712 plus cancer-registry fields 40005/40006), 9 lifestyle tokens (three levels each of BMI, smoking and alcohol), 2 sex tokens, 1 'no event' token and 1 non-informative padding token. 'No event' tokens are added at 1 per 5 years by sampling 20 uniform times in (0, 36,525) days, intersected with each person's data range; sex tokens sit at birth, and lifestyle token times are randomized by −20 to +40 years around enrolment to break confounding with immortal time bias. Fig. 1b reports 502,485 UK Biobank individuals with 7,426,036 tokens. - 2
划分训练、验证与检验数据 · Split data for honest testing
输入是第 1 步得到的词元序列。UK Biobank 参与者被随机分成两份:80%(402,799 人)用来教模型,20%(100,639 人)留出来检查和调整模型;此外还有两次“面向未来”的检验:把某个截点日期之后的记录全部藏起来,空出 1 年,再让模型预测下一年里的新发诊断——一次针对 2020 年年中仍在世的 471,057 名 UK Biobank 参与者,一次针对 1.93 million(193 万)名 50–80 岁的丹麦居民,其登记编码已转换成相同格式。这就像先用没见过的题考学生,再用下学期的试卷考,最后用另一个国家学校出的试卷考;不同的是,英国的“未来”检验里有些人的早年记录模型学过,只有他们后来的结局是新的。The input is the token sequences from step 1. UK Biobank participants are randomly split so that 80% (402,799 people) are used to teach the model and 20% (100,639) are held back to check and tune it; on top of that, two 'future' tests hide everything after a cut-off date, skip one year, and ask the model to predict new diagnoses in the following year — once for the 471,057 UK Biobank participants still alive in mid-2020 and once for 1.93 million Danish residents aged 50–80, whose registry codes were converted to the same format. It is like marking students on unseen questions, then on next term's exam, and finally on an exam set by a school in another country; unlike a clean exam, the UK 'future' test includes people whose earlier years the model studied, and only their later outcomes are new.为什么这样做Why this step模型在学过的人身上可能表现很好,换一批人就失灵;留出的个体、更晚的时间窗和另一个国家的医疗系统,依次检验难度越来越大的泛化能力。A model can look excellent on the people it learned from yet fail elsewhere, so held-out people, a later time window and another country's health system test progressively harder kinds of generalization.技术细节Technical detail · M1, M2, M5, M8, M9, M10, M15, M16, M21, M38, M39, M40, M41, M74UK Biobank 个体按 80/20 随机划分(训练 402,799 人、验证 100,639 人;数据自出生至 2020 年 6 月 30 日;验证集同时用于超参数优化)。内部纵向检验:截点时仍在世的全部 471,057 人,预测 1 年时间框内的发生率,间隔 1 年,评估 2021 年 7 月 1 日至 2022 年 7 月 1 日 50–80 岁人群的发病;外部纵向检验:2016 年 1 月 1 日时 50–80 岁的丹麦居民(1.93 million;女性 51%),输入截至该日,评估窗口为 2017 年 1 月 1 日至 2018 年 1 月 1 日,直接沿用英国训练得到的权重、不作任何修改。丹麦数据按 UK Biobank 格式统一(只保留首次发生、ICD-8 映射到 ICD-10、取三位码、删除 UK Biobank 中没有的编码、无生活方式词元)。Random 80/20 split of UK Biobank individuals (402,799 training, 100,639 validation; data from birth to 30 June 2020; the validation set also served for hyperparameter optimization). Internal longitudinal test: all 471,057 individuals alive at the cut-off, rates predicted over a 1-year frame, a 1-year gap, and incidence evaluated from 1 July 2021 to 1 July 2022 for ages 50–80; external longitudinal test: Danish residents aged 50–80 on 1 January 2016 (1.93 million; 51% female), inputs up to that date and evaluation from 1 January 2017 to 1 January 2018, using the UK-trained weights unchanged. Danish data were harmonized to UK Biobank (first occurrences only, ICD-8 mapped to ICD-10, level-3 codes, codes absent from UK Biobank dropped, lifestyle tokens absent). - 3
把 GPT-2 改造成病史模型 · Adapt GPT-2 to health timelines
起点是 GPT-2——OpenAI 在 2019 年公开的文本生成模型,也是 ChatGPT 背后那类模型的前身:它把每个词元变成一串数字(嵌入,embedding),再用注意力机制(attention)衡量前面哪些词元对预测下一个词元最重要。作者改了三处:告诉模型“这是第几个词”的位置信号换成了这个人的真实年龄;预测某个条目时,禁止模型参考与它同一时刻记录的其他条目;再加一个输出,估计距下一个事件还有多久。改造后的 Delphi 能在病史的任何时间点,给出 1,256 种疾病及死亡各自的每日发生率,由此同时推出“下一件是什么”和“多快发生”。这就像把手机输入法的联想功能升级,不仅猜你下一个词,还猜你什么时候会打出来;不同的是,病史条目之间隔着的是真实的时间。The starting point is GPT-2, a text generator released by OpenAI in 2019 and a forerunner of the models behind ChatGPT: it turns each token into a list of numbers (an embedding) and uses attention to weigh which earlier tokens matter for predicting the next one. The authors change three things — the signal that tells the model a word's position is replaced by the person's actual age, the model is barred from looking at other entries recorded at the same moment as the one being predicted, and a second output estimates how long until the next event. The result, Delphi, gives for any point in a history a rate per day for each of 1,256 diseases plus death, from which both 'what comes next' and 'how soon' follow. It is like upgrading phone autocomplete so that it suggests not only the next word but also when you will type it; unlike text, the space between entries is real clock time.为什么这样做Why this step标准 GPT-2 只知道词的先后顺序,不知道两词之间隔了多久,所以它本身既无法回答疾病大约何时发生,也处理不好同一天记录的多个诊断。Standard GPT-2 knows only the order of words, not the time between them, so on its own it could neither say when a disease is likely to occur nor handle several diagnoses recorded on the same day.技术细节Technical detail · M24, M26, M27, M28, M30, M45结构沿用 nanoGPT 实现的 GPT-2(词元嵌入与输出层共享权重(weight tying);N 个前置层归一化的模块,每个含多头因果自注意力和前馈层),图 1c 中标红的改动有三处:用正弦/余弦函数(最低频率 1/365)经可训练线性层组合而成的年龄编码取代位置编码;因果连续时间掩码,额外屏蔽与被预测词元时间戳相同的词元;以及输出距事件时间的 Exp 头。logits 即对数速率,λi = exp(logit_i):下一个词元为 j 的概率是 λj/Σiλi(即 softmax),等待时间服从速率为 Σiλi 的指数分布,一年内发生的概率为 P = 1 − exp(−λ × 365.25)。The architecture follows nanoGPT's GPT-2 (token embedding weight-tied to the output layer; N× pre-LayerNorm blocks of multi-head causal self-attention and feed-forward layers), with three changes marked red in Fig. 1c: an age encoding of sine and cosine functions (lowest frequency 1/365) mixed by a trainable linear layer in place of positional encoding, a causal continuous-time mask that also hides tokens sharing the predicted token's timestamp, and an Exp head for time to event. Logits are log-rates, λi = exp(logit_i): the next token is j with probability λj/Σiλi (the softmax), the waiting time is exponential with rate Σiλi, and P(event within a year) = 1 − exp(−λ × 365.25).C1 · 词元与序列(token / sequence) · Tokens and sequencesC4 · 下一词元预测与交叉熵(cross-entropy) · Next-token prediction and cross-entropyC5 · Transformer 与注意力机制(attention) · Transformer and attentionC6 · 嵌入(embedding)与 UMAP 降维 · Embeddings and UMAPC9 · 位置编码与年龄编码 · Positional encoding vs age encodingC10 · 竞争风险与指数等待时间 · Competing risks and exponential waiting times - 4
调模型大小并检验改动 · Tune size, test design choices
作者用训练集和验证集训练了 486 个大小不同的模型版本——区别在于每个词元用多长的一串数字表示、叠了多少层注意力、每层有几个注意力“头”(head,即几条并行的回看通道)——并在留出的验证集人群上逐一打分。结果显示,对 UK Biobank 这样规模的数据,约 2 million(200 万)个可调数字(参数,parameter)最合适,因此选定了一个有 2.2 million(220 万)参数的版本,即 Delphi-2M;作者还把新加的部件逐个去掉,并改变表示平静期的“无事件”词元出现的频率,以检验每处改动是否真的有用。这就像为一门课挑笔记本:太小记不下,太大就开始抄无关的噪声;不同的是,这里的“合适大小”取决于数据有多少。Using the training and validation sets, the authors trained 486 versions of the model that differ in size — how long a list of numbers each token gets, how many attention layers are stacked, and how many attention 'heads' (parallel ways of looking back) each layer has — and scored each on the held-out validation people. The scores showed that, for data of UK Biobank's size, about 2 million adjustable numbers (parameters) is the sweet spot, so they kept a 2.2-million-parameter version, Delphi-2M; they also removed the new parts one at a time, and varied how often the quiet-period 'no event' tokens appear, to check that each change helps. It is like choosing a notebook for a course: too small and the notes do not fit, too large and you start copying noise instead of the lesson — except that here the right size depends on how much data there is.为什么这样做Why this step模型相对数据太大,就会记住个人而不是学到规律;逐个去掉新部件,则能看出提升究竟来自这些改动,还是只来自模型规模。A model too large for its data memorizes individuals instead of learning patterns, and removing each new part in turn shows whether the modifications, rather than sheer size, account for the gains.技术细节Technical detail · M22, M25, M34, M35, M36超参数筛查覆盖上下文长度(48、56、64)、嵌入维度(60–156)、层数(6–16)和注意力头数(6–16),共 486 个模型,以验证集交叉熵比较;在训练数据比例 0.05–1.0 下的规模定律(scaling law)分析提示约 2 million 参数最优;Delphi-2M 的嵌入维度为 120、12 层、12 个头(2.2 million 参数;扩展数据图 2 中上下文长度为 48,正文未定义该设置)。消融实验以各年龄上相对于年龄–性别基线的交叉熵,比较 Delphi-2M、NanoGPT-2M、加填充的 NanoGPT-2M 以及去掉指数损失的 Delphi-2M;填充实验则以每 1–50 年 1 个或不加“无事件”词元训练模型(每种设置 3 个随机种子)。The hyperparameter screen covered context size (48, 56, 64), embedding dimension (60–156), layers (6–16) and heads (6–16) in 486 models compared by validation cross-entropy, and a scaling-law analysis over training fractions 0.05–1.0 indicated about 2 million parameters as optimal; Delphi-2M has embedding dimension 120, 12 layers and 12 heads (2.2 million parameters; context size 48 in Extended Data Fig. 2, a setting the text does not define). The ablation compared Delphi-2M with NanoGPT-2M, NanoGPT-2M with padding and Delphi-2M without the exponential loss by age-wise cross-entropy relative to an age–sex baseline, and the padding experiment trained models with 'no event' rates of 1 per 1–50 years or none (3 seeds each). - 5
训练:猜下一事件及时间 · Train: guess next event, timing
把 402,799 份训练病史输入模型;在每份病史的每个时间点,模型都要说出下一件事是什么、还要多久发生,每轮之后把内部数字微调一点,让真实答案的可能性变大——共 200,000 轮,每轮 128 份病史。性别、BMI、吸烟和饮酒只作为背景被读入,模型从不预测它们。这就像实习医生逐行读几千份病历,每读一行就用卡片盖住下一行,先猜再看;不同的是,模型还得猜出下一行上写的日期。The 402,799 training histories are fed to the model; at every point in each history it must say what comes next and how long until it happens, and after each round its internal numbers are nudged slightly so that the true answer becomes more likely — 200,000 rounds of 128 histories each. Sex, BMI, smoking and alcohol are only read as context and are never themselves predicted. It is like a trainee reading thousands of charts line by line, covering the next line with a card and guessing it before looking; unlike the trainee, the model must also guess the date written on that next line.为什么这样做Why this step同时预测下一事件“是什么”和“何时发生”,迫使模型输出可以当作发病率来读的绝对速率,而不只是哪种病更可能发生的排序。Having to predict both the identity and the timing of the next event forces the model to output absolute rates that can be read as incidences, not just a ranking of which disease is more likely.技术细节Technical detail · M28, M31, M32, M33总损失 = lossj + lossT,其中 lossj = −log P(j) 是下一个词元的交叉熵,lossT = −log p(T*) = −(logsumexp(logits) − sum(exp(logits)) × T*) 是等待时间的指数分布对数似然;性别、生活方式和不携带信息的填充词元的 logits 设为 −Inf、不进入损失,因此两项损失只在疾病词元和“无事件”词元上计算。优化使用 Adam(标准参数),共 200,000 次迭代,批量 128,预热 1,000 次迭代后学习率按余弦从 6 × 10⁻⁴ 衰减到 6 × 10⁻⁵,采用 32 位精度;同一时刻发生的多个事件都从最后一个非同时发生的词元出发预测。Total loss = lossj + lossT, where lossj = −log P(j) is the cross-entropy of the next token and lossT = −log p(T*) = −(logsumexp(logits) − sum(exp(logits)) × T*) is the exponential log-likelihood of the waiting time; sex, lifestyle and non-informative padding tokens have logits set to −Inf and are excluded, so both terms are evaluated only on disease and 'no event' tokens. Optimization used Adam (standard parameters) for 200,000 iterations, batch size 128, 1,000 warmup iterations and cosine decay of the learning rate from 6 × 10⁻⁴ to 6 × 10⁻⁵, in 32-bit precision; co-occurring events are each predicted from the last non-co-occurring token. - 6
对照基准评估预测 · Score predictions against benchmarks
训练好的模型给出的发生率,要在留出的英国人群、英国“未来”检验和丹麦检验中接受两方面检查:后来得了某病的人,是否比没得的人被给了更高的发生率(AUC,在各性别的 5 年年龄段内分别计算,免得只靠年龄就能区分);预测的发生率是否与观察到的发生率一致(校准,calibration)。同样的检查也用于简单的年龄–性别发病率表、现成的临床工具(心血管病的 QRisk3、SCORE2、PREVENT、Framingham,痴呆的 UKBDRS,死亡的 Charlson 与 Elixhauser),以及机器学习模型(从数据中学规律的计算机模型),其中包括用自然语言提问、让它给出风险估计的类 ChatGPT 模型 LLama3.1。这就像评价天气预报员:既看下雨的日子是否事先被给了更高的降雨概率,也看报“30% 降雨概率”的日子是否真有大约 30% 下了雨。The trained model's predicted rates are checked on the held-out UK people, the UK 'future' test and the Danish test in two ways: whether people who went on to get a disease had been given higher rates than people who did not (AUC, computed inside 5-year age bands for each sex so that age alone cannot do the work), and whether predicted rates match observed rates (calibration). The same checks are run on simple age-and-sex incidence tables, on established tools — QRisk3, SCORE2, PREVENT and Framingham for cardiovascular disease, UKBDRS for dementia, Charlson and Elixhauser for death — and on machine-learning models (computer models that learn patterns from data), including a ChatGPT-like model, LLama3.1, asked in plain words for a risk estimate. It is like judging a weather forecaster both on whether rainy days had received higher rain chances and on whether '30% chance' days really saw rain about 30% of the time.为什么这样做Why this step单个总体 AUC 可能掩盖年龄的作用,排序好也不代表绝对风险对,所以需要区分度、校准和与基准的正面比较三方面一起判断这些发生率能否实际使用。A single overall AUC can hide the effect of age, and a good ranking can still give wrong absolute risks, so discrimination, calibration and head-to-head baselines are all needed to judge whether the rates are usable in practice.技术细节Technical detail · M23, M42, M46, M47, M49, M50, M51, M52, M53, M54, M55, M60, M61, M62, M63, M64, M65, M66, M67, M68, M69, M70, M71, M72, M73非纵向 AUC:按发病年龄把病例分入 50–80 岁的 5 年年龄段并加入年龄匹配的对照,用预测发生率计算 AUC,对病例多于 2 例的年龄段取平均,男女分开(部分分析只用结局发生前至少 N 个月记录的词元),DeLong 方差合并为 N(μ, σ²);校准在验证集上用对数线性风险分箱,在纵向检验中用预测发生率十分位组,发病率交叉熵则比较模型与观测的年发病率。纵向 ROC-AUC 与平均精确率(scikit-learn)纳入至少 25 例的疾病;Nelson–Aalen 年龄–性别基线英国部分来自训练数据、丹麦部分来自 2010–2016 年全体丹麦人口,对照模型的协变量缺失用 MICE 插补(5 份,按 Rubin 规则合并),正面比较的终点为 CVD、痴呆和死亡。其他比较包括 MILTON 已发表的 AUC(410 种疾病)、HbA1c 等生物标志物、总体健康自评,以及在多基因风险评分或生物标志物之外加入 Delphi logits 的线性模型;另用 4 种不同划分重新训练以检验可重复性。Non-longitudinal AUC: cases stratified into 5-year age brackets (50–80 years) with age-matched controls, AUC from predicted rates averaged over brackets with more than 2 cases, by sex (some analyses used only tokens recorded N or more months before the outcome), with DeLong variances combined as N(μ, σ²);calibration used log-linear risk bins (validation) or deciles of predicted rate (longitudinal), and incidence cross-entropy compared modelled with observed annual incidence. Longitudinal ROC-AUC and average precision (scikit-learn) covered diseases with at least 25 cases; the Nelson–Aalen age–sex baseline came from the training data (UK) or the 2010–2016 Danish population, comparators' missing covariates were imputed by MICE (5 copies, Rubin's rules), and the head-to-head end points were CVD, dementia and death. Further comparisons used MILTON's published AUCs (410 diseases), biomarkers such as HbA1c, self-rated health and linear models adding Delphi logits to polygenic scores or biomarkers, and retraining on 4 different splits checked reproducibility. - 7
生成未来与合成病史 · Simulate future and synthetic histories
给定某人到某个年龄为止的病史(或只给出生时的性别),模型按预测的发生率随机抽出下一个事件及其时间,把它接到病史后面,再重复这一过程,就像手机输入法的联想功能一个词接一个词地写出一整段话。作者对 63,622 名验证集参与者从 60 岁开始这样模拟(每人一条未来轨迹,到 80 岁截止),再与他们的真实经历比较;又从出生开始生成 400,000 份完全虚构的人生病史(合成数据),用来训练一个从未见过真实病人的新模型,然后在真实的验证数据上检验。就像飞行模拟器,每次模拟只是一条可能的路径,而不是确定的预言,所以要把模拟出的发病率与观察到的发病率比较,并把每个人模拟出的诊断与其后来真实得到的诊断对照。Given a history up to some age, or just a person's sex at birth, the model draws the next event and its timing at random in line with its predicted rates, adds it to the history and repeats, the way phone autocomplete can write a whole paragraph one word at a time. This was done for 63,622 validation participants from age 60 (one simulated future each, stopped at age 80) and compared with what actually happened to them, and 400,000 entirely artificial life histories (synthetic data) were generated from birth to train a fresh model that never saw a real patient, which was then tested on the real validation data. Like a flight simulator, each run is one plausible path rather than a certain forecast, so the simulations are checked by comparing simulated with observed disease rates and each person's simulated diagnoses with the ones that person actually received.为什么这样做Why this step能把病史向前推演的模型,可以估计人群未来的疾病负担,还能产生不照搬任何真实个人记录的训练数据;把模拟结果与观察结果对照,则能检验它是否学到了疾病如何逐步展开,而不只是下一步。A model that can roll histories forward can estimate future disease burden for groups and produce training data that do not copy any real person's record, and comparing simulated with observed patterns tests whether it has captured how diseases unfold rather than only the next step.技术细节Technical detail · M29, M37, M43, M44, M55抽样时,下一个疾病词元从疾病 logits 的 softmax 分布中抽取(舍弃性别和生活方式的 logits),时间取各速率为 λi 的指数分布样本中的最小值,反复迭代得到轨迹,80 岁后截断,并用同样的发病率比较方法评估。60 岁实验以验证集个体 60 岁前的全部数据为条件(据图 3a 图注 n = 63,622,均在 60 岁前后都有记录;第 4 页正文写作 63,662);合成数据模型用 400,000 条从出生开始、性别随机分配的抽样轨迹训练,超参数不变,并在真实验证数据上评估。Sampling draws the next disease token from the softmax over disease logits (sex and lifestyle logits discarded) and the time as the minimum of samples from exponentials with rates λi, iterated to build trajectories that are truncated after age 80 and evaluated with the same incidence comparisons. The age-60 experiment conditioned on all validation data before age 60 (n = 63,622 with records before and after 60 per the Fig. 3a caption; the p. 4 text says 63,662), and the synthetic-data model was trained on 400,000 trajectories sampled from birth with random sex, using unchanged hyperparameters, and evaluated on the observed validation data. - 8
解释预测并排查偏倚 · Explain predictions and probe biases
作者用 100,639 份验证集病史,一次藏起一个或几个既往条目,测量每个条目能让预测发生率变化多少(SHAP);又把模型为每个诊断学到的那串数字画成二维地图上的点,模型看来相似的疾病会挨在一起(UMAP);这些效应再与经典的生存分析相互印证,即比较有无某个诊断的人随着时间推移发生事件的快慢。作者还用统计检验比较不同族裔、不同贫困程度人群中的准确度是否不同,并考察记录来源(全科医生、医院或自我报告)是否左右了预测。SHAP 回答的是“如果这个诊断从未被记录,预测会怎样变化”——它描述的是模型的推理,可能反映数据的收集方式,并不能证明一种病导致另一种病。Using the 100,639 validation histories, the authors hide past entries one or several at a time and measure how much each one moves the predicted rate (SHAP), and they draw each diagnosis's learned list of numbers as a point on a 2-D map where diseases the model treats alike sit close together (UMAP); these effects are cross-checked against classical survival analyses, which compare how quickly people with and without a given diagnosis go on to have an event over time. They also use a statistical test to see whether accuracy differs across ethnic groups and levels of deprivation, and look at whether the source of a record (GP, hospital or self-report) shapes the predictions. SHAP answers 'how would this prediction change if this diagnosis had never been recorded?' — it describes the model's reasoning, which can mirror how the data were collected, and is not proof that one disease causes another.为什么这样做Why this step风险模型在用于决策之前,需要弄清它学到的关联是否合理、准确度在不同人群间是否有差异,以及它是否吸收了记录方式带来的假象。Before a risk model informs decisions, one needs to know whether its learned associations are plausible, whether its accuracy differs between population groups, and whether it has absorbed artefacts of record-keeping.技术细节Technical detail · M14, M56, M57, M58, M59, M75, M76, M77, M78SHAP 使用 PartitionExplainer,被屏蔽的词元替换为“无事件”(性别词元换成相反性别),应用于全部 100,639 条验证集轨迹,被解释的始终是最后一个词元;平均 SHAP 值与惩罚性时间依赖 Cox 模型的系数,以及粗略的 Nelson–Aalen 风险比(每个病例配 5 名年龄–性别匹配者,高斯核平滑)相比较;UMAP(余弦度量)作用于 1,270 × 120 的词元嵌入矩阵。亚组异质性检验基于 DeLong 法得到的亚组 AUC、逆方差加权的标准化残差,以及自由度为 (n − 1) 的 χ² 统计量,阈值经 Bonferroni 校正(剔除病例少于 6 例的年龄–性别组);族裔和多重剥夺指数只用于分层;数据来源偏倚分析只在图注中有描述。SHAP used the PartitionExplainer with masked tokens replaced by 'no event' (sex tokens swapped to the opposite sex) on all 100,639 validation trajectories, always explaining the last token; averaged SHAP values were compared with penalized time-dependent Cox coefficients and with crude Nelson–Aalen hazard ratios (5 age–sex-matched controls per case, Gaussian-kernel smoothing), and UMAP (cosine metric) was applied to the 1,270 × 120 token-embedding matrix. Subgroup heterogeneity used DeLong subgroup AUCs, inverse-variance weighted standardized residuals and a χ² statistic with (n − 1) degrees of freedom at Bonferroni-corrected thresholds (age–sex brackets with fewer than 6 cases filtered), with ethnicity and the index of multiple deprivation used only for stratification; the data-source bias analyses are described only in figure captions.
读懂方法需要的前置知识Concepts you need first
C1
词元与序列(token / sequence) · Tokens and sequences
词元是固定清单中的一个符号:在文本里是一个词或词的片段,在 Delphi 里是一个诊断编码、性别、一档生活方式或“无事件”。序列就是按时间顺序排好的这些符号,这样一个人的病史就能像语言模型处理句子那样被处理。
A token is one symbol from a fixed list: in text, a word or word piece; in Delphi, a diagnosis code, sex, a lifestyle level or 'no event'. A sequence is such symbols in time order, which lets a person's medical history be handled the way a language model handles a sentence.
经典应用Classic uses
- ChatGPT 等大语言模型:把文本当作由词片段组成的词元序列来读写Large language models such as ChatGPT, which read and write text as sequences of word-piece tokens
- OpenAI 的 Whisper 等语音识别模型:把音频转换成文本词元序列Speech recognition models such as OpenAI's Whisper, which turn audio into a sequence of text tokens
C2
训练集、验证集、检验集与外部验证 · Training, validation and test sets; external validation
建模者用一部分数据让模型学习(训练集),用另一部分比较不同版本、挑选设置(验证集),再用模型从未见过的数据评判最终表现(检验集)。外部验证是在另一个人群、地点或时期重复这种评判,以说明模型离开建模环境后仍然有效。
Model builders learn from one part of the data (training), use a second part to compare versions and pick settings (validation), and judge the final model on data it never saw (test). External validation repeats that judgement in a different population, place or period to show that the model still works beyond where it was built.
经典应用Classic uses
- QRISK 心血管风险评分:在一批英国全科诊所的数据上建立,再在其他诊所和数据库中验证QRISK cardiovascular risk scores, developed in one set of UK general practices and validated in separate practices and databases
- Epic 脓毒症预测模型在密歇根大学医疗系统的外部验证(JAMA Internal Medicine,2021):表现不如开发商报告的好The external validation of the Epic Sepsis Model at Michigan Medicine (JAMA Internal Medicine, 2021), which found weaker performance than the developer had reported
C3
AUC 与校准(calibration) · AUC and calibration
AUC(ROC 曲线下面积)是随机抽一名后来发病者和一名未发病者时,前者被给出更高预测风险的概率:0.5 相当于抛硬币,1.0 表示排序完全正确。校准关心预测风险的绝对值是否准确,例如被预测为 10% 风险的人中,是否真有大约 10% 发病。
AUC (area under the ROC curve) is the chance that a randomly chosen person who develops the disease was given a higher predicted risk than a randomly chosen person who did not: 0.5 is a coin toss and 1.0 is perfect ranking. Calibration asks whether predicted risks are right in absolute terms, for example whether about 10% of people given a 10% risk actually develop the disease.
经典应用Classic uses
- 报告 Framingham 评分、QRISK3 等临床风险评分对心血管风险的区分度和校准Reporting how well clinical risk scores such as the Framingham score and QRISK3 rank and calibrate cardiovascular risk
- 用 ROC 分析确定诊断试验的切点,例如诊断心肌梗死的肌钙蛋白阈值ROC analysis for choosing cut-offs of diagnostic tests, such as troponin thresholds for myocardial infarction
C4
下一词元预测与交叉熵(cross-entropy) · Next-token prediction and cross-entropy
给模型看序列的开头,让它为每个可能的下一个词元给出概率;训练就是不断微调,让它给实际出现的下一个词元更高的概率,交叉熵用来给这种猜测打分(越低越好)。训练好的模型还能生成新序列:抽出下一个词元、接到末尾,如此反复。
The model is shown the start of a sequence and must give a probability to every possible next token; training nudges it to give more probability to what actually came next, and cross-entropy scores this (lower is better). A trained model can also write new sequences by drawing a next token, appending it and repeating.
经典应用Classic uses
- ChatGPT 背后的 GPT 系列模型:一次一个词元地写出文本The GPT models behind ChatGPT, which write text one token at a time
- 谷歌 Gboard 等手机输入法的下一词联想Next-word suggestions on smartphone keyboards such as Google's Gboard
C5
Transformer 与注意力机制(attention) · Transformer and attention
Transformer 是一种神经网络(由大量简单运算叠成,其中可调的数字称为参数,从数据中学得),它处理序列时让每个位置对允许看到的其他位置“加权关注”,从而找出哪些既往条目最重要。“因果”注意力只往回看,所以预测时绝不会用到后面的条目。
A transformer is a neural network (a large stack of simple calculations whose adjustable numbers, called parameters, are learned from data) that processes a sequence by letting each position weigh, or 'attend to', the other positions it is allowed to see, so it can pick out which past items matter most. 'Causal' attention only looks backwards, so a prediction never uses later entries.
经典应用Classic uses
- 机器翻译:Transformer 于 2017 年正是为这一任务提出的Machine translation, the task for which the transformer was introduced in 2017
- ChatGPT 等大语言模型Large language models such as ChatGPT
- AlphaFold 2:用基于注意力的网络预测蛋白质结构AlphaFold 2, which uses attention-based networks to predict protein structures
C6
嵌入(embedding)与 UMAP 降维 · Embeddings and UMAP
嵌入是模型为每个词元学到的一串数字(Delphi-2M 中每个词元 120 个数);模型看来相似的词元,数字串也相近。UMAP 把这样的长数字串压缩到二维平面上,并尽量让原本相近的点仍然相近,这样聚类就能用肉眼看出来。
An embedding is the list of numbers a model learns for each token (120 numbers per token in Delphi-2M); tokens the model treats similarly end up with similar lists. UMAP squeezes such long lists onto a 2-D map while trying to keep close neighbours close, so clusters can be seen by eye.
经典应用Classic uses
- word2vec 等词嵌入:意思相近的词彼此靠近Word embeddings such as word2vec, in which related words sit close together
- 单细胞 RNA 测序研究中用 UMAP 绘制的细胞类型图UMAP maps of cell types in single-cell RNA-sequencing studies
C7
SHAP(Shapley 加性解释) · SHAP (Shapley additive explanations)
SHAP 把一次预测拆分成各个输入的贡献,依据的是博弈论中在参与者之间公平分配收益的规则(Shapley 值):在许多种输入组合下,比较有无某个输入时预测的差别。贡献为正表示该输入把预测风险推高,为负表示把它拉低。
SHAP splits one prediction into contributions from each input, using a rule from game theory (Shapley values) for sharing a payout fairly among players: it compares the prediction with and without each input across many combinations. A positive contribution means that input pushed the predicted risk up; a negative one means it pulled the risk down.
经典应用Classic uses
- Prescience 系统解释手术中低氧血症的实时预测(Lundberg 等,Nature Biomedical Engineering,2018)Explaining real-time predictions of hypoxaemia during surgery in the Prescience system (Lundberg et al., Nature Biomedical Engineering, 2018)
- 用开源 shap 包为 XGBoost 等树模型绘制特征重要性图Feature-importance plots for tree-based models such as XGBoost, made with the open-source shap package
用于Used in: S8
C8
合成数据(synthetic data) · Synthetic data
合成数据是由学会了真实数据统计规律的模型生成的虚构记录。如果模型学得好,基于合成记录得到的结果会接近基于真实数据的结果,同时对任何真实个人透露的信息少得多,不过这一点需要专门检验。
Synthetic data are artificial records produced by a model that has learned the statistical patterns of real data. If the model has learned well, results from synthetic records resemble those from real ones while revealing far less about any real individual, although this has to be checked.
经典应用Classic uses
- Synthea:生成逼真但虚构的患者病历的开源工具Synthea, an open-source generator of realistic but fictional patient records
- 英国临床实践研究数据链(CPRD)发布的、供方法开发和培训使用的合成数据集Synthetic datasets released by the UK Clinical Practice Research Datalink (CPRD) for method development and training
用于Used in: S7
C9
位置编码与年龄编码 · Positional encoding vs age encoding
注意力机制本身不管先后顺序,所以文本 Transformer 会加上一个由正弦、余弦波构成的信号,标出每个词是第几个。Delphi 改为把以天计的年龄送进同样的波形信号,让模型看到两件事之间隔了多少真实时间,而不只是谁先谁后。
Attention by itself ignores order, so text transformers add a signal made of sine and cosine waves that marks each word's position (1st, 2nd, 3rd …). Delphi feeds the same kind of wave signal with the person's age in days instead, so the model sees how much real time separates two events, not merely which came first.
经典应用Classic uses
- 2017 年用于机器翻译的原版 Transformer,首次提出正弦–余弦位置编码The original 2017 transformer for machine translation, which introduced sine–cosine positional encodings
- BEHRT(2020):面向英国初级保健病历的 Transformer,为每个诊断加入年龄嵌入BEHRT (2020), a transformer for UK primary-care records that adds an age embedding to each diagnosis
用于Used in: S3
C10
竞争风险与指数等待时间 · Competing risks and exponential waiting times
竞争风险指几种可能的事件在“赛跑”,下一个被观察到的只是最先发生的那个,例如死亡可能先于痴呆发生。指数等待时间假设事件每天的发生速率恒定;许多这样的“时钟”一起赛跑时,某个事件抢先的概率等于它的速率除以所有速率之和,而第一个事件何时出现取决于这个总和。
Competing risks means several possible events are 'racing' and only the first one is observed next; for example, death can come before dementia. An exponential waiting time assumes an event has a constant rate per day; when many such clocks race, the chance that a given event comes first is its rate divided by the sum of all rates, and the time until the first event depends on that sum.
经典应用Classic uses
- Fine–Gray 竞争风险回归:在死亡可能阻止目标结局发生的临床研究中被广泛使用Fine–Gray competing-risk regression, widely used in clinical studies when death can prevent the outcome of interest
- 放射性衰变:指数等待时间的教科书式例子Radioactive decay, the textbook example of exponential waiting times
- 急诊科就诊到达的排队模型:常把相邻到达之间的间隔视为指数分布(泊松过程)Queueing models of emergency-department arrivals, which often treat the gaps between arrivals as exponential (a Poisson process)
方法细节(原文提取)Method details (from the paper) · 84
| M1 | 研究设计Study design | 预测模型研究:在 UK Biobank 上开发生成式 Transformer(Delphi-2M),通过随机划分的内部验证、内部纵向检验,以及在丹麦登记数据上“不改变参数”的外部纵向检验进行评价。 Prediction-model study: a generative transformer (Delphi-2M) is developed on UK Biobank and evaluated by random-split internal validation, internal longitudinal testing, and external longitudinal testing on Danish registries 'with no change in parameters'. | p. 1, 10 |
| M2 | 研究设计Study design | 纵向检验的目的是用明确的时间截点把输入数据和评估数据分开,以避免时间泄漏(time leakage),并考察预后能力和泛化能力;两个数据源使用同一套流程,只因数据可得性不同而采用不同的截点日期。 The longitudinal tests are meant to enforce an explicit cut-off that separates input from evaluation data (avoiding time leakage) and to show prognostic capability and generalization; the same setup is used for both data sources, with different cut-off dates owing to data availability. | p. 12 |
| M3 | 研究设计Study design | 研究没有产生或收集新数据,是对现有 UK Biobank 和丹麦登记数据的二次分析,研究本身没有招募受试者(见报告摘要(Reporting Summary))。 No new data were generated or collected: the study is a secondary analysis of existing UK Biobank and Danish registry data, with no recruitment for this study (Reporting Summary). | p. 13, 27–28 |
| M4 | 场景Setting | UK Biobank 是前瞻性队列,约 500,000 名来自不同人群背景的个体,于 2006 至 2010 年间在英国各地招募。 UK Biobank is a prospective cohort of approximately 500,000 individuals from various demographic backgrounds, recruited across the UK between 2006 and 2010. | p. 10 |
| M5 | 场景Setting | 丹麦各登记通过中央人口登记(Central Person Registry)的个人识别号关联(该登记同时提供性别和出生日期);国家患者登记(National Patient Registry,LPR)覆盖 1977 年以来的住院记录,死因登记(Register of Causes of Death)始于 1970 年;数据提取至 2019 年前后,即 LPR 报告改为 LPR3 之时。 Danish registries are linked through the personal identification number of the Central Person Registry (which also gives sex and date of birth); the National Patient Registry (LPR) covers hospital admissions since 1977 and the Register of Causes of Death starts in 1970; the extract runs to around 2019, when LPR reporting changed to LPR3. | p. 10 |
| M6 | 研究对象Participants | UK Biobank 参与者招募时年龄为 37–73 岁。 UK Biobank participants were 37–73 years old at recruitment. | p. 10 |
| M7 | 研究对象Participants | 图 1b 列出:UK Biobank 共 502,485 人、7,426,036 个 token;丹麦共 1,931,630 人、11,512,665 个 token。 Fig. 1b lists 502,485 individuals and 7,426,036 total tokens for UK Biobank, and 1,931,630 individuals and 11,512,665 total tokens for Denmark. | p. 3 |
| M8 | 研究对象Participants | 丹麦队列:2016 年 1 月 1 日居住在丹麦且年龄为 50–80 岁的所有个体,以使年龄范围与 UK Biobank 相近(2016 年 1 月 1 日是能保证整个预测期内全人群覆盖可靠的最晚日期);共 1.93 million(193 万)人(女性 51%,男性 49%)。 Danish cohort: all individuals residing in Denmark and aged 50–80 years on 1 January 2016, chosen to resemble the UK Biobank age range (1 January 2016 is the latest date with guaranteed reliable coverage over the whole prediction horizon); 1.93 million individuals (51% female, 49% male). | p. 10 |
| M9 | 研究对象Participants | 内部纵向检验集包括截点日期时仍在世的全部 UK Biobank 个体(471,057 人),因此并不限于 100,639 名验证集个体,必然包含训练集个体;正文(第 2 页)将其描述为 2020 年 7 月 1 日仍在世的 471,057 名参与者(94%)。 The internal longitudinal test set comprises all UK Biobank individuals still alive at the cut-off date (471,057), so it is not limited to the 100,639 validation individuals and necessarily includes training individuals; the main text (p. 2) describes these as 471,057 (94%) participants alive on 1 July 2020. | p. 10 |
| M10 | 研究对象Participants | 纵向评估只对 50–80 岁的个体做预测。 In the longitudinal evaluations, predictions are made for individuals aged 50–80 years. | p. 12 |
| M11 | 数据Data | UK Biobank 的健康结局来自其预先整理的首次发生数据(category 1712):ICD-10 第 I–XVII 章(不含第 II 章肿瘤)的三位码以及死亡,来源为关联的初级保健(cat. 3000)、住院记录(cat. 2000)、死亡登记(字段 40001 和 40002)或自我报告问卷(字段 20002)。 UK Biobank outcomes come from the pre-assembled first-occurrence data (category 1712): ICD-10 level-3 codes for chapters I–XVII excluding chapter II (neoplasms), plus death, taken from linked primary care (cat. 3000), hospital inpatient admissions (cat. 2000), the death registry (fields 40001 and 40002) or self-report questionnaires (field 20002). | p. 10 |
| M12 | 数据Data | 肿瘤诊断由作者从关联的癌症登记(字段 40005 和 40006)补入,只取首次发生并映射为 ICD-10 三位码,合计 1,256 种不同诊断;全部编码见补充表 5。 Neoplasms were added from the linked cancer registry (fields 40005 and 40006), restricted to the first occurrence and mapped to ICD-10 level 3, giving 1,256 distinct diagnoses in total; all codes are listed in Supplementary Table 5. | p. 10 |
| M13 | 数据Data | 输入协变量:自我报告性别(字段 31);招募时体格检查测得的 BMI(字段 21001),分为 BMI < 22 kg m−2、BMI > 28 kg m−2 和其余三档;吸烟(字段 1239),分为吸烟(1)、偶尔吸烟(2)和从不吸烟(0);饮酒频率(字段 1558),分为每天(1)、中等(2、3)和有限(4、5、6)。 Input covariates: self-reported sex (field 31); BMI from the recruitment physical assessment (field 21001), coded as BMI < 22 kg m−2, BMI > 28 kg m−2 or otherwise; smoking (field 1239), coded as smoker (1), occasionally smoking (2) or never smoker (0); alcohol intake frequency (field 1558), coded as daily (1), moderately (2, 3) or limited (4, 5, 6). | p. 10 |
| M14 | 数据Data | 自我报告的族裔背景(字段 21000;分为白人、混血、亚裔或英籍亚裔、黑人或英籍黑人、华人五组)和多重剥夺指数(index of multiple deprivation,字段 26410;涵盖七个领域)只用于按亚组分层评估表现,不参与模型训练。 Self-reported ethnic background (field 21000; five groups: white, mixed, Asian or Asian British, Black or Black British, Chinese) and the index of multiple deprivation (field 26410; seven domains) were extracted only to stratify performance by subgroup and were not used for training. | p. 10 |
| M15 | 数据Data | 丹麦数据按 UK Biobank 的格式统一:每种诊断只保留首次发生;全部编码转为 ICD-10 三位码;1995 年以前的诊断(ICD-8)用已发表的映射表(参考文献 38)转换;UK Biobank 中没有的编码被删除。 Danish data were harmonized with UK Biobank: only the first occurrence of each diagnosis was kept, all codes were transformed to ICD-10 level 3, diagnoses before 1995 (ICD-8) were converted with published mappings (ref. 38), and codes absent from UK Biobank were removed. | p. 10 |
| M16 | 数据Data | 对于丹麦,方法部分列出的诊断来源只有国家患者登记(住院)和死因登记,未提及初级保健、自我报告或癌症登记。丹麦输入数据包含 1978–2016 年间记录的 11.51 million(1151 万)个疾病 token(正文第 2 页称数据跨度为 1978 至 2018 年)。 For Denmark, the Methods name only the National Patient Registry (hospital admissions) and the Register of Causes of Death as diagnosis sources; no primary-care, self-report or cancer-registry source is mentioned. The Danish input has 11.51 million disease tokens recorded between 1978 and 2016 (the main text, p. 2, says the data span 1978 to 2018). | p. 10 |
| M17 | 数据Data | 每个数据点是一个(token, 年龄)对,年龄以出生后的天数计。词表包括 1,257 个 ICD-10 三位码疾病 token、9 个生活方式 token(饮酒、吸烟、BMI 各 3 档)、2 个性别 token、1 个“无事件”填充 token,以及 1 个放在序列开头或结尾、不携带信息的填充 token。正文(第 2 页)称共有 1,258 种不同状态,并对 1,256 个疾病 token 加死亡给出发生率;UMAP 所用的嵌入矩阵为 1,270 × 120(第 13 页)。若 1,257 个疾病 token 即 1,256 种诊断加上死亡,这些数字在算术上是一致的(1,257 + 1 个“无事件”= 1,258 种可预测状态;1,257 + 9 + 2 + 1 + 1 = 1,270),但原文没有明确说明。 Each datapoint is a (token, age) pair, with age in days from birth. The vocabulary has 1,257 ICD-10 level-3 disease tokens, 9 lifestyle tokens (three levels each for alcohol, smoking and BMI), 2 sex tokens, 1 'no event' padding token and 1 non-informative padding token at the start or end of sequences. The main text (p. 2) speaks of 1,258 distinct states and of rates for 1,256 disease tokens plus death; the UMAP embedding matrix is 1,270 × 120 (p. 13). These counts are arithmetically consistent if the 1,257 disease tokens are the 1,256 diagnoses plus death (1,257 + 1 'no event' = 1,258 predictable states; 1,257 + 9 + 2 + 1 + 1 = 1,270), but the paper does not spell this out. | p. 10 |
| M18 | 数据Data | “无事件”填充 token 以每 5 年 1 个的恒定速率加入:在 (0, 36525) 天范围内均匀抽取 20 个 token,与每个人的数据时间范围取交集后插入数据 token 之间;推断时也可以插入这类 token,以得到任意时间点的预测风险。 'No event' padding tokens were added at a constant rate of 1 per 5 years by uniformly sampling 20 tokens from the range (0, 36525) days and interleaving them with the data tokens after intersecting with each person's data range; such tokens can also be inserted at inference to obtain the predicted risk at any time of interest. | p. 10 |
| M19 | 数据Data | 性别 token 放在出生时刻;吸烟、饮酒和 BMI 数值记录于加入 UK Biobank 之时。 Sex tokens are placed at birth; smoking, alcohol and BMI values were recorded at enrolment into UK Biobank. | p. 10 |
| M20 | 偏倚控制Bias control | 由于入组时点恰好是永生时间偏倚(immortal time bias)结束之时,吸烟、饮酒和 BMI token 的时间在入组时点前后随机平移 −20 至 +40 年,以打断它们与死亡率骤升之间的混杂相关;作者指出这可能也削弱了这些 token 的真实效应。原文未说明随机平移所用的分布。 Because enrolment coincides with the end of immortal time bias, the times of smoking, alcohol and BMI tokens were randomized by −20 to +40 years around enrolment to break a confounding correlation with a sudden jump in mortality; the authors note this probably also diminishes the true effect of these tokens. The distribution of the random shift is not stated. | p. 10–11 |
| M21 | 样本量Sample size | 原文未给出正式的样本量或检验效能计算。报告摘要的“Sample size”一栏只说明采用常规的训练–验证–测试划分,并写训练集 402,786 人(随机 80%)、验证集 100,636 人(20%),而方法部分(第 10 页)写作 402,799 人和 100,639 人。 No formal sample-size or power calculation is given. The Reporting Summary 'Sample size' entry only describes a standard train–validation–test split and gives 402,786 (random 80%) training and 100,636 (20%) validation individuals, whereas the Methods (p. 10) give 402,799 and 100,639. | p. 29 |
| M22 | 样本量Sample size | 模型规模与可用数据量是否匹配,通过规模定律(scaling law)筛查来考察(在训练数据比例 0.05、0.1、0.3、0.6 和 1.0 下比较最优验证损失与参数量;图 1e,第 3 页);作者称筛查结果提示,对 UK Biobank 而言约 2 million(200 万)个参数最优。 Model size relative to the available data was examined with a scaling-law screen (optimal validation loss vs number of parameters for training-data fractions 0.05, 0.1, 0.3, 0.6 and 1.0; Fig. 1e, p. 3); the authors state that the screen indicates about 2 million parameters as optimal for UK Biobank. | p. 2 |
| M23 | 样本量Sample size | 评估的最低病例数规则:纵向 AUC/APS 和校准纳入所有病例数至少为 25 例的疾病;丹麦评估涵盖 796 个 ICD-10 编码上的 0.96 million(96 万)个疾病 token,每个编码至少 25 例(第 10 页);报告摘要(第 29 页)则称 AUC-ROC 和 SHAP 只使用在 UK Biobank 验证数据中记录多于 25 条的疾病。 Minimum-case rules for evaluation: longitudinal AUC/APS and calibration include all diseases with at least 25 cases; the Danish evaluation covers 0.96 million disease tokens across 796 ICD-10 codes, each with at least 25 cases (p. 10); the Reporting Summary (p. 29) says that only diseases with more than 25 entries in the UK Biobank validation data were used for AUC-ROC and SHAP. | p. 13 |
| M24 | 模型Model | 模型结构沿用 nanoGPT 实现的 GPT-2:查表式 token 嵌入层;多层由因果自注意力(causal self-attention)和前馈网络组成、带层归一化和原版 GPT 残差连接的 Transformer 层;最后由线性投影输出各 token 的 logits。token 嵌入与输出层共享权重(weight tying)。 The architecture follows GPT-2 as implemented in nanoGPT: a lookup-table token embedding, repeated transformer layers of causal self-attention and feed-forward blocks with layer normalization and the original GPT residual connections, and a final linear projection to token logits; token-embedding and final-layer weights are tied (weight tying). | p. 10 |
| M25 | 模型Model | Delphi-2M 的嵌入维度为 120,12 层,12 个注意力头(共 2.2 million,即 220 万个参数),原文称其为筛查中最优区间内的模型之一;扩展数据图 2(第 16 页)标示其上下文长度(context size)为 48。 Delphi-2M has an embedding dimensionality of 120, 12 layers and 12 heads (2.2 million parameters) and is described as one of the models within the optimal range of the screen; Extended Data Fig. 2 (p. 16) marks it at context size 48. | p. 2 |
| M26 | 模型Model | 年龄编码取代了 GPT 的位置编码:用不同频率的正弦和余弦函数表示年龄(最低频率为 1/365),再经可训练的线性变换组合;由于没有与 token 位置绑定的参数,模型可以处理任意长度的输入。 Age encoding replaces GPT's positional encoding: age is represented by sine and cosine functions of different frequencies (lowest frequency 1/365), linearly combined by a trainable linear transformation; because no parameters are tied to token positions, inputs of arbitrary length can be handled. | p. 11 |
| M27 | 模型Model | 因果注意力掩码经过修改,额外屏蔽与被预测 token 同一时刻记录的位置;不携带信息的填充 token 在预测其他 token 时也被屏蔽。 Causal attention masks were amended to also mask positions recorded at the same time as the predicted token; non-informative padding tokens are masked for predictions of other tokens. | p. 11 |
| M28 | 模型Model | 输出模型(竞争指数模型,competing exponentials):n 个可预测 token 各自的等待时间服从速率为 λi = exp(logitsi) 的指数分布;下一个事件为 token j 的概率是 λj/Σiλi(即 softmax),距下一事件的时间 T* 服从速率为 Σi exp(logitsi) 的指数分布。该近似要求速率在短期内恒定,填充 token 使期望等待时间不超过 5 年;同时发生的事件都从最后一个非同时发生的 token 出发预测。 Output model (competing exponentials): each of the n predictable tokens has an exponential waiting time with rate λi = exp(logitsi); the probability that token j comes next is λj/Σiλi (the softmax), and the time to the next event T* is exponential with rate Σi exp(logitsi). This assumes rates that are constant over short periods, which the padding keeps to at most 5 years in expectation; co-occurring events are each predicted from the last non-co-occurring token. | p. 11 |
| M29 | 模型Model | 抽样:下一个疾病 token 从 logits 的 softmax 分布中抽取,时间取各速率为 λi 的指数分布样本中的最小值;非疾病 token(性别、生活方式)的 logits 不参与抽样;反复迭代即可生成完整轨迹(第 2 页)。 Sampling: the next disease token is drawn from the softmax over the logits, and the time is the minimum of samples drawn from all exponential distributions with rates λi; logits of non-disease tokens (sex, lifestyle) are discarded; repeating this step samples whole trajectories (p. 2). | p. 11 |
| M30 | 模型Model | logits 即发生率(每日速率)的对数,例如一年内发生某事件的概率为 P(T < 365.25) = 1 − exp(−exp(logit) × 365.25)。 Logits are log-rates (rates per day), so, for example, the probability of an event within a year is P(T < 365.25) = 1 − exp(−exp(logit) × 365.25). | p. 11 |
| M31 | 训练Training | 总损失 = lossj + lossT,其中 lossj = −log P(j) = cross_entropy(logits, tokens),lossT = −log p(T*) = −(logsumexp(logits) − sum(exp(logits)) × T*)。 Total loss = lossj + lossT, where lossj = −log P(j) = cross_entropy(logits, tokens) and lossT = −log p(T*) = −(logsumexp(logits) − sum(exp(logits)) × T*). | p. 11 |
| M32 | 训练Training | 性别、饮酒、吸烟、BMI 以及不携带信息的填充 token 只作输入:其 logits 设为 −Inf,两个损失项只在疾病 token 和“无事件”填充 token 上计算。 Sex, alcohol, smoking, BMI and non-informative padding tokens are input-only: their logits are set to −Inf and both loss terms are evaluated only on disease and 'no event' padding tokens. | p. 11 |
| M33 | 训练Training | 优化:用 Adam 优化器(标准参数)做随机梯度优化,共 200,000 次迭代,批量大小 128,预热 1,000 次迭代后学习率按余弦调度从 6 × 10⁻⁴ 衰减到 6 × 10⁻⁵;使用 32 位浮点精度。 Optimization: stochastic gradient optimization with Adam (standard parameters) for 200,000 iterations, batch size 128, 1,000 warmup iterations, then cosine learning-rate decay from 6 × 10⁻⁴ to 6 × 10⁻⁵; 32-bit float precision. | p. 11 |
| M34 | 训练Training | 超参数搜索:独立训练 486 个模型,搜索上下文长度(48、56、64)、嵌入维度(60–156)、层数(6–16)和注意力头数(6–16),以验证集交叉熵比较,并用随机森林评估各超参数的重要性;20% 验证集同时用于“验证和超参数优化”(第 2 页)。 Hyperparameter search: 486 independently trained models over context size (48, 56, 64), embedding dimension (60–156), number of layers (6–16) and heads (6–16), compared by validation cross-entropy, with random-forest-based hyperparameter importance; the 20% validation set was used for 'validation and hyperparameter optimization' (p. 2). | p. 16 |
| M35 | 训练Training | 消融实验(ablation):将 Delphi-2M 与 NanoGPT-2M、加填充的 NanoGPT-2M 以及去掉指数损失的 Delphi-2M 比较,指标为各年龄上相对于年龄–性别基线的交叉熵差值(图 1f,第 3 页;补充表 1、补充图 2)。 Ablation: Delphi-2M is compared with NanoGPT-2M, NanoGPT-2M with padding, and Delphi-2M without the exponential loss, using the cross-entropy difference relative to an age- and sex-based baseline across ages (Fig. 1f, p. 3; Supplementary Table 1 and Supplementary Fig. 2). | p. 2 |
| M36 | 敏感性分析Sensitivity | 填充速率实验:分别以每 1、2、5、10、20 或 50 年 1 个“无事件”token 的速率以及不加填充训练 Delphi-2M(每种设置用不同随机种子训练 3 个重复模型),以只计疾病 token 的 UK Biobank 验证集交叉熵比较;另在 4,000 个随机验证时间点上比较模型估计的填充速率与真实速率。 Padding-rate experiment: Delphi-2M was trained with 'no event' rates of 1 token per 1, 2, 5, 10, 20 or 50 years and without padding (3 replicate models with different seeds per setting) and compared by UK Biobank validation cross-entropy over disease tokens only; the estimated vs true padding rate was checked at 4,000 random validation timepoints. | p. 15 |
| M37 | 训练Training | 合成数据模型:用从 Delphi-2M 自出生起抽样生成、性别随机分配的 400,000 条轨迹(与原训练集规模相同)训练,训练超参数不变,并在真实验证数据上评估(第 5 页)。 Synthetic-data model: trained on 400,000 trajectories sampled from Delphi-2M from birth with randomly assigned sex (the same size as the original training set), with unchanged training hyperparameters, and evaluated on the observed validation data (p. 5). | p. 13 |
| M38 | 验证Validation | UK Biobank 按个体随机分为训练集 402,799 人(80%)和验证集 100,639 人(20%),两者都使用自出生至 2020 年 6 月 30 日的数据;验证集用来评估模型对同一队列中其他个体的泛化能力。报告摘要(第 29 页)称按 4:1 随机划分,丹麦数据不作划分。 UK Biobank was split at random into 402,799 (80%) training and 100,639 (20%) validation individuals, both using data from birth until 30 June 2020; validation assesses generalization to other individuals of the same cohort. The Reporting Summary (p. 29) describes a random 4:1 division and no splitting of the Danish data. | p. 10 |
| M39 | 验证Validation | 纵向检验流程:对每个人收集截点日期之前的数据;Delphi-2M 预测所有疾病 token 在 1 年时间框内的发生率;截点后的第一年作为数据间隔被舍弃;再用其后一年的发病情况进行评估。 Longitudinal procedure: data are collated up to a cut-off date for each individual; Delphi-2M predicts rates for all disease tokens over a 1-year time frame; the year after the cut-off is discarded as a data gap; incidence in the following year is used for evaluation. | p. 12 |
| M40 | 验证Validation | 内部纵向检验评估 2021 年 7 月 1 日至 2022 年 7 月 1 日的发病情况,使预测与评估之间留出 1 年间隔;图 1b(第 3 页)则把 UK Biobank 训练/验证数据块的终点标为 2021 年,纵向检验的终点标为 2023 年。 The internal longitudinal test evaluates incidence from 1 July 2021 to 1 July 2022, enforcing a 1-year gap between predictions and evaluation; Fig. 1b (p. 3) labels the UK Biobank training/validation block as ending in 2021 and longitudinal testing as ending in 2023. | p. 10 |
| M41 | 验证Validation | 丹麦登记数据上的外部纵向检验:用 2016 年 1 月 1 日之前的数据做预测,以 2017 年 1 月 1 日至 2018 年 1 月 1 日的发病情况评估;Delphi-2M 直接沿用 UK Biobank 训练得到的权重,没有重新训练或作任何调整(第 7 页)。 External longitudinal test on Danish registries: predictions use data available up to 1 January 2016 and are evaluated on incidence from 1 January 2017 to 1 January 2018; Delphi-2M was transferred with the UK Biobank-trained weights, with no retraining or adjustments (p. 7). | p. 10 |
| M42 | 验证Validation | 可重复性:用不同的训练–验证划分重新训练 Delphi-2M(n = 4 次独立实验;补充图 1),并在 UK Biobank 纵向数据和丹麦登记数据上检验。 Reproducibility: Delphi-2M was retrained with different train–validation splits (n = 4 independent experiments; Supplementary Fig. 1) and tested on longitudinal UK Biobank data and Danish registry data. | p. 13 |
| M43 | 验证Validation | 在验证队列上评估生成能力:(1)仅以性别 token 从出生开始生成轨迹,检查能否重现分性别的发病模式;(2)以 60 岁前的全部数据为条件模拟之后的轨迹,每人一条,80 岁后截断(该年龄以上训练数据很少),并用同样方法比较发病模式。 Generative evaluation on the validation cohort: (1) trajectories generated from birth using only sex tokens, to check sex-specific incidence patterns; (2) trajectories simulated from all data up to age 60, one per proband and truncated after age 80 (little training data beyond it), with incidence patterns compared in the same way. | p. 12 |
| M44 | 验证Validation | 据图 3a 图注,从 60 岁起的模拟使用 60 岁前后均有疾病记录的验证集个体(n = 63,622),每人模拟一条轨迹,并与本人的观测结局比较;正文(第 4 页)则称可比较 63,662 条抽样轨迹与观测轨迹。 Per the Fig. 3a caption, the age-60 simulation uses validation individuals with disease records both before and after age 60 (n = 63,622), with one simulated trajectory per individual compared with that person's observed outcomes; the main text (p. 4) instead speaks of 63,662 sampled and observed trajectories. | p. 4–5 |
| M45 | 结局Outcome | 预测目标:下一个 token(疾病、死亡或“无事件”)及距其发生的时间;输入部分轨迹后,模型输出 1,256 个疾病 token 及死亡各自的每日发生率。 Prediction target: the next token (disease, death or 'no event') and the time until it; given a partial trajectory, the model returns a rate per day for each of the 1,256 disease tokens plus death. | p. 2 |
| M46 | 结局Outcome | 纵向检验的结局是评估年内新发的诊断;与其他算法比较时的终点为心血管疾病(CVD,ICD-10 I20–25、I63、I64、G45)、痴呆(F00、F01、F03、G30、G31)和死亡。 Longitudinal outcomes are incident diagnoses in the evaluation year; the end points for the comparison with other algorithms are cardiovascular disease (ICD-10 I20–25, I63, I64, G45), dementia (F00, F01, F03, G30, G31) and death. | p. 12 |
| M47 | 结局Outcome | 与临床指标的比较采用招募后 5 年的时间窗;线性模型则用招募时已有的数据预测 5 年内是否发病(第 12 页)。 Comparisons with clinical markers use a 5-year window after recruitment, and the linear models predict 5-year disease occurrence from data available at recruitment (p. 12). | p. 13 |
| M48 | 测量Measurement | 报告摘要“Blinding”一栏:使用 UK Biobank 提供的匿名化患者标识;丹麦数据未做额外设盲,理由是本分析并非临床试验。 Reporting Summary 'Blinding': anonymised patient identifiers provided by UK Biobank were used, and no additional blinding was performed for the Danish data because the analysis is not a clinical trial. | p. 29 |
| M49 | 统计Statistics | 按年龄和性别分层的发病率(训练集):按每一岁分组,观测病例数除以风险人数;风险人数取该性别受试者总数减去累计死亡人数,以处理删失(censoring)。 Age- and sex-stratified incidence (training set): observed counts in annual age brackets divided by the number at risk, taken as the number of probands of each sex minus the cumulative number of deaths to account for censoring. | p. 11 |
| M50 | 统计Statistics | 非纵向 AUC:按目标疾病发生时的年龄,把病例轨迹分入 50–80 岁之间的各 5 年年龄段,每段加入年龄匹配的对照轨迹,在段内用预测发生率计算 AUC,再对病例多于 2 例的年龄段取平均,男女分别计算。原文未说明对照的数量和抽取方式;扩展数据图 5 和图 10(第 19、26 页)则写作 40–80 岁的 5 年年龄组。 Non-longitudinal AUC: trajectories with the disease of interest are stratified into 5-year age brackets from 50 to 80 years by age at occurrence, age-matched control trajectories are added to each bracket, and the AUC is computed from predicted rates within each bracket and averaged over brackets with more than two cases, separately by sex. The number and sampling of controls are not stated; Extended Data Figs. 5 and 10 (p. 19, 26) describe 5-year age groups from 40 to 80 years. | p. 11 |
| M51 | 统计Statistics | 时间间隔变体:部分分析只用目标疾病发生前至少 N 个月记录的 token 进行预测。 Time-gap variant: for some analyses only tokens recorded N or more months before the disease of interest are used for the prediction. | p. 11 |
| M52 | 统计Statistics | AUC 置信区间:用 DeLong 法得到每个年龄–性别组的均值和方差;疾病层面的 AUC 视为 N(μ, σ²),其中 μ = (1/n)Σμi,σ² = (1/n²)Σσi²。 AUC confidence intervals: DeLong's method gives the mean and variance for each age–sex bracket; the disease-level AUC is taken as N(μ, σ²) with μ = (1/n)Σμi and σ² = (1/n²)Σσi². | p. 11 |
| M53 | 统计Statistics | 校准(非纵向):找出某 token 在各 5 年年龄段内的全部病例,并为其余每位受试者在同一年龄段随机选一个对照数据点;若前一个 token 距事件不足 1 年,则取该 token 处的预测;预测发病率按对数线性分箱,范围为 10−6 至 1,倍增步长为 log10(5);观测年发病率为各年龄段病例与对照的平均值除以 5 年;男女分别计算。扩展数据图 3a(第 17 页)则写作按 10 的幂次分箱。 Calibration (non-longitudinal): all cases of a token in 5-year age bins are identified and, for every other proband, one control datapoint is randomly selected in the same age band; predictions are taken at the preceding token if it is less than a year earlier; predicted incidences are grouped log-linearly into bins from 10−6 to 1 with multiplicative increments of log10(5); observed annual incidence is the average of cases and controls in age bins divided by 5 years; done separately by sex. Extended Data Fig. 3a (p. 17) describes bins of powers of 10. | p. 11 |
| M54 | 统计Statistics | 纵向表现:用 scikit-learn 计算 ROC-AUC 和平均精确率(APS),比较评估期内的观测病例与截点时得到的预测分数;校准则把 Delphi-2M 预测发生率分成十分位组,比较组内平均预测率与观测率;纳入所有至少 25 例的疾病。 Longitudinal performance: ROC-AUC and average precision (APS) from scikit-learn, comparing observed cases in the evaluation period with scores obtained at the cut-off; calibration compares the mean Delphi-2M rate with the observed rate within deciles of predicted rate; all diseases with at least 25 cases are included. | p. 13 |
| M55 | 统计Statistics | 发病率交叉熵用于比较模型与观测的年发病率:H(p,q) = −p × log(q) − (1 − p) × log(1 − q),在所有年龄组和两种性别上计算。 Incidence cross-entropy compares annual modelled and observed incidences: H(p,q) = −p × log(q) − (1 − p) × log(1 − q), evaluated across all age groups and sexes. | p. 12 |
| M56 | 统计Statistics | SHAP:对验证集轨迹屏蔽一个或多个 token 作扰动(被屏蔽的 token 换成“无事件”占位符,性别 token 换成相反性别),再用 SHAP 包的 PartitionExplainer 汇总 logits 的变化。该流程应用于全部 100,639 条验证集轨迹,被解释的始终是轨迹中最后一个可用 token;图 4c(第 6 页)的 SHAP 矩阵涵盖出现次数多于 5 次的 778 个疾病 token。 SHAP: validation trajectories are perturbed by masking one or several tokens (masked tokens are replaced by the 'no event' placeholder, sex tokens by the opposite sex), and the logit changes are aggregated with the PartitionExplainer of the SHAP package. This was applied to all 100,639 validation trajectories, always for the last available token; the SHAP matrix in Fig. 4c (p. 6) covers 778 disease tokens with more than 5 occurrences. | p. 13 |
| M57 | 统计Statistics | 对 Delphi-2M 学到的 token 嵌入矩阵(1,270 × 120)做 UMAP 降维,距离采用余弦度量。 UMAP (cosine metric) was applied to the learned token-embedding matrix of Delphi-2M (1,270 × 120). | p. 13 |
| M58 | 统计Statistics | 为解读 SHAP 值,将平均 SHAP 值与针对电子健康记录(EHR)开发的惩罚性时间依赖 Cox 模型(参考文献 15)的风险估计相比较;扩展数据图 7(第 22 页)展示 10 种选定疾病,正则化使许多系数为零。 To interpret SHAP values, averaged SHAP values are compared with hazard estimates from a penalized time-dependent Cox model developed for EHR data (ref. 15); Extended Data Fig. 7 (p. 22) shows 10 selected diseases and a regularized model with many zero coefficients. | p. 13 |
| M59 | 统计Statistics | 非参数风险比:对携带某 token 的个体估计该 token 出现之后的 Nelson–Aalen 累积风险,并为每个病例随机选 5 名年龄–性别匹配者估计对照组的累积风险;对累积风险求导并用高斯核平滑得到风险率,两者之比即随时间变化的粗略风险比。 Nonparametric hazard ratios: the Nelson–Aalen cumulative hazard from the token onward in carriers is compared with that of five randomly selected age–sex-matched individuals per case; hazards are obtained as derivatives of the cumulative hazards, smoothed with a Gaussian kernel, and their ratio gives a crude hazard ratio over time. | p. 13 |
| M60 | 模型Model | 附加线性模型:一组线性回归模型,用招募时的数据预测 5 年内是否发病,均包含性别和年龄,另取以下预测因子的不同子集:多基因风险评分(UKB Category 301)、MILTON 研究所用的生物标志物(缺失超过 100,000 条者剔除,其余用 MICE 插补;扩展数据图 5(第 19 页)称共 57 个)、总体健康自评(字段 2178)以及目标疾病的 Delphi logits;采用同样的年龄–性别分层 AUC 评估。 Secondary linear models: a family of linear regression models predicting 5-year disease occurrence from data at recruitment, each with sex and age plus subsets of polygenic risk scores (UKB Category 301), biomarkers as used by MILTON (those with more than 100,000 missing values excluded, the rest imputed with MICE; 57 biomarkers per Extended Data Fig. 5, p. 19), overall health rating (field 2178) and the Delphi logits for the disease; evaluated with the same age- and sex-stratified AUC. | p. 12 |
| M61 | 偏倚控制Bias control | 在线性模型分析中,乳腺癌只纳入女性;对 E10(胰岛素依赖型糖尿病),计算 logits 时从 Delphi 的输入中屏蔽其他糖尿病编码(E11–E14)。 In the linear-model analysis, only female participants were included for breast cancer, and for E10 (insulin-dependent diabetes mellitus) all other diabetes codes (E11–E14) were masked from the Delphi inputs when computing logits. | p. 12 |
| M62 | 对照Comparator | 流行病学基线:用 Nelson–Aalen 估计量得到所有疾病按性别和年龄分层的人群发生率;UK Biobank 部分基于与 Delphi-2M 相同的训练数据,丹麦部分基于 2010–2016 年的全体丹麦人口。 Epidemiological baseline: sex- and age-stratified population rates from the Nelson–Aalen estimator across all diseases, estimated on the Delphi-2M training data for UK Biobank and on the entire Danish population in 2010–2016 for Denmark. | p. 12 |
| M63 | 对照Comparator | 对照模型:心血管病用 QRisk3、SCORE2(R 包 RiskScorescvd)、PREVENT(R 包 preventr)、Framingham(R 包 CVrisk 的 10y_cvd_frs)、Transformer、AutoPrognosis v2.0 和 LLama3.1(8B);痴呆用 UKBDRS、Transformer 和 LLama3.1(8B);死亡用 Charlson 与 Elixhauser(R 包 comorbidity)、Transformer 和 LLama3.1(8B)。 Comparators: for CVD, QRisk3, SCORE2 (R RiskScorescvd), PREVENT (R preventr), Framingham (R CVrisk 10y_cvd_frs), a Transformer, AutoPrognosis v2.0 and LLama3.1 (8B); for dementia, UKBDRS, the Transformer and LLama3.1 (8B); for death, Charlson and Elixhauser (R comorbidity), the Transformer and LLama3.1 (8B). | p. 12 |
| M64 | 对照Comparator | Framingham 采用含实验室指标的 2008 版;QRisk3 由作者依据在线计算器自行实现(报告摘要第 28 页注明为 QRISK3-2017);UKBDRS 由作者依原文自行实现;其余模型均采用公开实现。 Framingham uses the 2008 version with laboratory measurements; QRisk3 is the authors' own implementation based on the online calculator (QRISK3-2017 per the Reporting Summary, p. 28); UKBDRS is the authors' own implementation of the original paper; all other models use publicly available implementations. | p. 13 |
| M65 | 对照Comparator | 各算法不同程度地使用共 60 个协变量(补充表 5);若某人的数据超出某算法规定的协变量范围,其评分记为 NA,并从该项评估中剔除;原本基于 ICD-10 四位码的定义用三位码近似(第 13 页)。 A total of 60 covariates (Supplementary Table 5) are used to varying degrees across algorithms; if an individual's data fall outside an algorithm's defined covariate ranges, the score is set to NA and the individual is dropped from that evaluation; definitions based on ICD-10 level-4 codes are approximated with level-3 codes (p. 13). | p. 12 |
| M66 | 对照Comparator | Charlson 和 Elixhauser 指数与 Delphi 使用相同数据;由于 Charlson 指数原本基于 ICD-10 四位码,作者把三位码映射到所有可能的四位码来估计(另估计了一个三位码版本,表现略差)。 Charlson and Elixhauser indices use the same data as Delphi; because the Charlson index is defined on ICD-10 level-4 codes, it was estimated by mapping level-3 codes to all possible level-4 codes (a level-3 version was also estimated and performed marginally worse). | p. 13 |
| M67 | 对照Comparator | Transformer 对照模型:PyTorch 的 TransformerEncoder,上下文长度 128 个 token,嵌入维度 128,2 个多头注意力模块,共 2 个编码层,其余为默认参数,最后接线性层输出预测分数;用 2014 年 1 月 1 日、2016 年 1 月 1 日和 2018 年 1 月 1 日三个时点的 UK Biobank 数据片段拼接拟合,token 与 Delphi 相同,另加 5 年一档的当前年龄 token(50–80 岁),任务是二分类预测未来 2 年内是否发生结局。 Transformer comparator: a PyTorch TransformerEncoder with context length 128 tokens, embedding size 128, 2 multi-head attention blocks, 2 encoder layers and otherwise default parameters, plus a linear output layer; it was fitted on concatenated UK Biobank excerpts at 1 January 2014, 1 January 2016 and 1 January 2018, using Delphi's tokens plus 5-year age-bin tokens (50–80 years), as a binary classifier of the outcome within the next 2 years. | p. 12 |
| M68 | 对照Comparator | AutoPrognosis v2.0 用 2014 年 1 月 1 日提取的数据拟合,协变量沿用既往定义(参考文献 34),插补算法设为 MICE,拟合算法用默认设置。 AutoPrognosis v2.0 was fitted on data extracted on 1 January 2014 with previously defined covariates (ref. 34), MICE as the imputation algorithm and default fitting algorithms. | p. 13 |
| M69 | 对照Comparator | LLama3.1(8B;原文给出的是 Ollama 模型库链接)通过提示词扮演风险评估工具,根据年龄、性别、BMI、吸烟、饮酒和既往 ICD-10 编码给出未来 5 年发生 CVD(ICD-10 I20、I21、I22、I23、I24、I25、I63、I64、G45)的概率,提示词中附一个示例;原文只给出了这一条 CVD 提示词。 LLama3.1 (8B; the text links to the Ollama model library) was prompted to act as a risk assessment tool and return the probability of CVD (ICD-10 I20, I21, I22, I23, I24, I25, I63, I64, G45) in the next 5 years from age, sex, BMI, smoking, alcohol and past ICD-10 codes, with one worked example in the prompt; only this CVD prompt is shown. | p. 13 |
| M70 | 对照Comparator | MILTON:直接从其补充材料中取用诊断、预后和不限时间三类模型报告的 AUC,按 ICD-10 三字符编码对接,共有 410 种疾病可与 MILTON 预后模型比较。 MILTON: the reported AUCs of its diagnostic, prognostic and time-agnostic models were taken from its supplementary material and linked on 3-character ICD-10 codes, allowing 410 diseases to be compared with MILTON prognostic models. | p. 13 |
| M71 | 对照Comparator | UK Biobank 总体健康自评(字段 2178)取自 Delphi-2M 的训练数据集,作为有序预测因子(取值 1–4,数值越大健康越差),对招募中心访视之后出现的所有疾病计算 AUC。 The UK Biobank overall health rating (field 2178), extracted for the Delphi-2M training dataset, was used as an ordered predictor (values 1–4, increasingly poor health) in AUCs for all diseases observed after the recruitment-centre visit. | p. 13 |
| M72 | 对照Comparator | 临床指标对照:糖尿病(E10–14)直接用 UK Biobank 测得的 HbA1c,贫血(D60–D64)用血红蛋白/平均红细胞体积;慢性肝病(K70–77)则用以碱性磷酸酶、丙氨酸氨基转移酶、γ-谷氨酰转移酶、总蛋白、白蛋白、胆红素和血糖为协变量的逻辑回归预测值。 Clinical-marker comparators: direct UK Biobank measurements of HbA1c for diabetes (E10–14) and of haemoglobin/mean corpuscular volume for anaemia (D60–D64); for chronic liver disease (K70–77), predictions of a logistic regression on alkaline phosphatase, alanine aminotransferase, gamma-glutamyltransferase, total protein, albumin, bilirubin and glucose. | p. 13 |
| M73 | 缺失数据Missing data | 对照算法的协变量缺失用链式方程多重插补(multivariate imputation by chained equations,R 包 mice)处理,保留 5 份插补数据,在每份中计算评分后按 Rubin 规则合并。 For the comparator algorithms, missing covariates were imputed by multivariate imputation by chained equations (R mice) with five imputed copies; scores were estimated in each copy and aggregated by Rubin's rules. | p. 12 |
| M74 | 缺失数据Missing data | 对 Delphi 而言,缺失的信息以“没有相应 token”的方式表示:丹麦数据没有生活方式信息,因此 BMI、吸烟和饮酒指示 token 按缺失处理。 For Delphi, unavailable information is represented by absent tokens: lifestyle information is not available in the Danish data, so the BMI, smoking and alcohol indicators were treated as absent. | p. 10 |
| M75 | 亚组Subgroup | 亚组异质性检验:对每种疾病,用 DeLong 法得到各亚组 AUC 的均值 μs 和方差 σs²;以逆方差加权均值 μ = Σ(μs/σs²)/Σ(1/σs²) 计算标准化残差 rs = (μs − μ)/σs,按双侧 Bonferroni 校正阈值识别离群亚组;疾病层面计算 χ² = Σrs²,自由度为 (n − 1),按单侧 Bonferroni 校正阈值判断。 Subgroup heterogeneity test: per disease, the subgroup AUC mean μs and variance σs² come from DeLong's method; standardized residuals rs = (μs − μ)/σs use the inverse-variance weighted mean μ = Σ(μs/σs²)/Σ(1/σs²) and flag outliers at a two-sided Bonferroni-corrected threshold; at disease level, χ² = Σrs² with (n − 1) degrees of freedom is tested against a one-sided Bonferroni-corrected threshold. | p. 12 |
| M76 | 亚组Subgroup | 由于 DeLong 法在小样本下有局限,在每个疾病–亚组组合内剔除病例少于 6 例的年龄–性别组,并排除剩余年龄组少于 2 个或亚组少于 2 个的疾病。 Because DeLong's method is limited in small samples, age–sex brackets with fewer than six cases were filtered out within each disease–subgroup combination, and diseases with fewer than two remaining brackets or fewer than two subgroups were excluded. | p. 12 |
| M77 | 亚组Subgroup | 其他分层只出现在图注中:按性别、ICD-10 章节、饮酒、吸烟和 BMI 分层的 AUC(扩展数据图 4c),以及 1944 年前出生者与 1960 年后出生者的比较(扩展数据图 10j);扩展数据图 10b 按 Townsend 剥夺指数分档,而方法部分写的是多重剥夺指数(字段 26410)。 Further stratifications appear only in figure captions: AUC by sex, ICD-10 chapter, alcohol, smoking and BMI (Extended Data Fig. 4c) and by birth year before 1944 vs after 1960 (Extended Data Fig. 10j); Extended Data Fig. 10b groups deprivation by Townsend deprivation index bins, whereas the Methods name the index of multiple deprivation (field 26410). | p. 18, 26 |
| M78 | 其他Other | 数据来源偏倚分析只在图注中有描述:缺失偏倚以首个住院(或初级保健)token 出现后的相对发生率表示,并对该 token 对此来源的专属程度作图,配以 loess 趋势线(图 5e、f);“主导来源”定义为某疾病 65% 以上记录的来源(图 5g),而扩展数据图 9c 展示的是某一来源占 75% 以上记录的 token;扩展数据图 9a 使用了一个按来源区分 token 的 Delphi 模型。 Data-source bias analyses are described only in figure captions: missingness bias is the relative rate after a first hospital (or primary-care) token, plotted against how exclusive a token is to that source, with loess trends (Fig. 5e,f); a dominating source is the origin of more than 65% of a disease's records (Fig. 5g), while Extended Data Fig. 9c shows tokens with more than 75% of entries from one source; Extended Data Fig. 9a uses a Delphi model with source-specific tokens. | p. 7, 25 |
| M79 | 伦理Ethics | UK Biobank 已获英国国家卫生与社会保健信息治理委员会(National Information Governance Board for Health and Social Care)及 NHS 西北研究伦理委员会(ref. 11/NW/0382)批准;所有参与者均签署书面知情同意,并可随时退出;本研究依托 UK Biobank 项目 49978 开展,遵循《赫尔辛基宣言》。 UK Biobank has approval from the National Information Governance Board for Health and Social Care and the NHS North West Centre for Research Ethics Committee (ref. 11/NW/0382); all participants gave written informed consent and could withdraw at any time; the work used UK Biobank project 49978 and followed the Declaration of Helsinki. | p. 14 |
| M80 | 伦理Ethics | 丹麦国家患者登记的使用遵守欧盟《通用数据保护条例》(GDPR)和丹麦《数据保护法》,并在丹麦统计局(Statistics Denmark)的保密与信息安全政策下进行;丹麦《健康研究项目与健康数据研究项目伦理审查法》(Committee Act)不适用于这类行政数据的二次分析。 Use of the Danish National Patient Registry complied with the EU General Data Protection Regulation and the Danish Data Protection Act, under Statistics Denmark's confidentiality and information security policies; the Danish Act on Ethics Review of Health Research Projects and Health Data Research Projects (the Committee Act) does not apply to this type of secondary analysis of administrative data. | p. 14 |
| M81 | 数据与代码Availability | UK Biobank 数据需经受限申请获取;丹麦登记数据需向丹麦患者安全局和丹麦卫生数据管理局申请,在安全的专用环境中使用;论文附有源数据(source data)。 UK Biobank data are available under restricted access; Danish registry data can be used in secure, dedicated environments after application to the Danish Patient Safety Authority and the Danish Health Data Authority; source data are provided with the paper. | p. 14 |
| M82 | 数据与代码Availability | Delphi 代码、脚本和 Jupyter 笔记本发布在 GitHub(gerstung-lab/delphi;报告摘要第 28 页注明 commit 6132df6);模型权重文件(checkpoint)按 UK Biobank 的受控访问程序提供(upload ID 7318)。 Delphi code, scripts and Jupyter notebooks are on GitHub (gerstung-lab/delphi; commit 6132df6 per the Reporting Summary, p. 28); the model checkpoint is available through UK Biobank's controlled-access procedures (upload ID 7318). | p. 14 |
| M83 | 软件Software | 软件:Python 3.11.9(pytorch 2.3.0、numpy 1.26.4、pandas 2.2.2、shap 0.45.1、umap-learn 0.5.6、scikit-learn 1.4.2、scikit-survival 0.22.2、statsmodels 0.14.2、autoprognosis 0.1.21、matplotlib 3.8.4、seaborn 0.13.2);R 4.2.3 用于作图;R 4.4.0 用于方法比较(CVrisk 1.1.1、glmnet 4.1-8、mice 3.16.0、preventr 0.10.0、RiskScorescvd 0.2.0、comorbidity 1.1.0)。参考文献列表(第 14 页)引用的则是 mice 3.18.0 和 preventr 0.11.0。 Software: Python 3.11.9 (pytorch 2.3.0, numpy 1.26.4, pandas 2.2.2, shap 0.45.1, umap-learn 0.5.6, scikit-learn 1.4.2, scikit-survival 0.22.2, statsmodels 0.14.2, autoprognosis 0.1.21, matplotlib 3.8.4, seaborn 0.13.2); R 4.2.3 for plotting; R 4.4.0 for method comparison (CVrisk 1.1.1, glmnet 4.1-8, mice 3.16.0, preventr 0.10.0, RiskScorescvd 0.2.0, comorbidity 1.1.0). The reference list (p. 14) cites mice 3.18.0 and preventr 0.11.0. | p. 27–28 |
| M84 | 其他Other | 资助与利益关系:资助来自 Novo Nordisk 基金会、Robert Bosch 基金会、EMBL-EBI 和 Villum 基金会(开放获取费用由 DKFZ 承担);已就“用生成式 Transformer 架构建模疾病竞争风险与发生时间”提交专利申请(PCT/EP2025/065771;申请人为 DKFZ 和 EMBL),六位作者列为发明人;一位作者声明持有 Hoba Therapeutics、Novo Nordisk、Lundbeck 和 Eli Lilly 的权益,另一位作者是 Oxford Nanopore 的顾问和股东。 Funding and interests: funding from Novo Nordisk Foundation grants, the Robert Bosch Foundation, EMBL-EBI and the Villum Foundation (open access funded by DKFZ); a patent application (PCT/EP2025/065771; applicants DKFZ and EMBL) on generative transformer architectures for modelling competing disease risks and timings lists six authors as inventors; one author declares ownership interests in Hoba Therapeutics, Novo Nordisk, Lundbeck and Eli Lilly, and another is a consultant and shareholder of Oxford Nanopore. | p. 14 |
研究结果Results
- 在 1,000 多种诊断上,Delphi-2M 判断谁会先发生某种疾病的能力,在内部验证中年龄-性别分层平均 AUC 约为 0.76(死亡为 0.97);97% 的诊断 AUC 高于 0.5。 p. 2, 4Across more than 1,000 diagnoses, Delphi-2M ranked who would develop a disease next with an average age–sex-stratified AUC of about 0.76 in internal validation (death: 0.97); 97% of diagnoses scored above 0.5. p. 2, 4
- 预测距离越远,准确度逐渐下降:从下一事件的 0.76 降到 10 年后约 0.70。在死亡、痴呆和心血管疾病上与现有评分接近(例如心血管疾病 0.70 对 QRISK3 的 0.71),但在糖尿病上不如 HbA1c(0.75 对 0.84)。 p. 3–4, 18Accuracy fell gradually with forecast distance, from 0.76 for the next event to about 0.70 ten years ahead. For death, dementia and cardiovascular disease it performed close to established scores (e.g., CVD 0.70 vs QRISK3 0.71), but worse than HbA1c for diabetes (0.75 vs 0.84). p. 3–4, 18
- 不做任何调整直接用于丹麦登记数据中的 193 万人,平均 AUC 为 0.67(UK Biobank 时间外推测试为 0.69),两地逐病 AUC 的相关系数 r = 0.76(95% CI 0.72–0.80)。 p. 7Applied unchanged to 1.93 million people in Danish registries, the average AUC was 0.67 (vs 0.69 in UK Biobank temporal testing), and per-disease AUCs correlated at r = 0.76 (95% CI 0.72–0.80). p. 7
- 从 60 岁开始模拟的轨迹再现了 70–75 岁时的人群发病率;第一年约 17% 的疾病标记被正确预测,20 年后降到 14% 以下(仅用年龄和性别为 12–13%);只用合成数据训练的模型 AUC 达到 0.74。 p. 5Trajectories simulated from age 60 reproduced population disease rates at ages 70–75 and correctly predicted about 17% of disease tokens in the first year, falling below 14% after 20 years (age and sex alone: 12–13%); a model trained only on synthetic data reached an AUC of 0.74. p. 5
- 可解释性分析显示,疾病按器官系统聚集,影响有持久和短暂之分(癌症多年持续抬高死亡率,败血症的影响约 5 年内消退);同时也发现模型学到了数据收集方式的规律:在有其他住院记录的人身上,仅见于住院记录的疾病预测发生率约高 10 倍。 p. 6–8Explainability analyses showed diseases clustering by organ system and effects that are either lasting (cancers raise mortality for years) or short-lived (septicaemia's effect fades within about 5 years), but also that the model learned data-collection patterns: hospital-only diseases were predicted about ten times higher when other hospital records existed. p. 6–8
- 作者认为,该模型是一个有前景、可跨体系迁移的多病预测与卫生规划工具,应作为现有临床工具的补充而非替代。 p. 8–9The authors conclude that the model is a promising, transferable tool for multi-disease prediction and health planning that should add to, not replace, existing clinical tools. p. 8–9
关键数字Key numbers
各诊断平均的年龄–性别分层 AUC(预测下一个事件,内部验证)Average age–sex-stratified AUC across diagnoses (next event, internal validation)
0.76AUC
评估了男性 906 种、女性 957 种诊断;97% 的诊断 AUC > 0…Evaluated for 906 diagnoses in men and 957 in women; 97% of diagnoses had AUC > 0.5. No…
p. 2
预测后 10 年的平均 AUCAverage AUC 10 years after the prediction
0.70AUC
预测下一事件时为 0.76;图 2e 中位数在 0 个月为 0.766,12…Down from 0.76 for next-event prediction; Fig. 2e medians are 0.766 at 0 months and 0.695…
p. 3
丹麦登记数据上的平均 AUC(外部验证,未重新训练)Average AUC on Danish registry data (external, no retraining)
0.67AUC
跨疾病标准差 0.09;UK Biobank 纵向测试为 0.69(标准差…s.d. 0.09 across diseases, vs 0.69 (s.d. 0.09) for UK Biobank longitudinal testing.…
p. 7
模拟第一年中预测正确的疾病 token 比例Correctly predicted disease tokens in the first simulated year
17%
20 年后降到 14% 以下;只用年龄和性别为 12–13%。模拟从验证集参…Falls below 14% after 20 years; age and sex alone give 12–13%. Simulations start at age…
p. 5
UK Biobank 训练集人数UK Biobank training participants
402,799participants
占 UK Biobank 的 80%。这个 2.2 百万参数的模型输出 1,…80% of UK Biobank. The 2.2-million-parameter model outputs rates for 1,256 disease tokens…
p. 2
仅用合成数据训练的 Delphi 的 AUCAUC of Delphi trained only on synthetic data
0.74AUC
在真实验证数据上评估,比原模型低 3 个百分点(n = 1,334 个疾病–…Evaluated on real validation data, 3 percentage points below the original model (n =…
p. 5
效应量与置信区间Estimates with confidence intervals
逐病 AUC 相关:UK Biobank 纵向测试 vs 丹麦登记数据Per-disease AUC correlation: UK Biobank longitudinal test vs Danish registries
0.76Pearson r
95% CI 0.72–0.80 · null = 0
p. 7
样本与分析集Samples & analysis sets · 6
UK Biobank 队列(已转成 token 的健康记录,图 1b)UK Biobank cohort with tokenised health records (Fig. 1b)
502,485
训练集(随机 80%)Training set (random 80%)
402,799
内部验证集(随机 20%;用于验证和超参数优化)Internal validation set (random 20%; validation and hyperparameter optimisation)
100,639
验证集中 60 岁前后都有疾病记录的参与者(轨迹模拟实验)Validation participants with disease records both before and after age 60 (simulation experiment)
63,662
纵向测试集(2020-07-01 仍在世的 UK Biobank 参与者)Longitudinal test set (UK Biobank participants alive on 2020-07-01)
471,057
丹麦登记数据外部测试队列(沿用 UK Biobank 权重,未重新训练)Danish registry external test cohort (UK Biobank weights, no retraining)
1,931,630
数据表Data table
| UK Biobank 队列(已转成 token 的健康记录,图 1b)UK Biobank cohort with tokenised health records (Fig. 1b) | 502,485 | 第 3 页图 1b:共 7,426,036 个 token,记录始于 1934 年。正文给出的两组人数相加为 503,438(402,799 + 100,639),比此图多 953 人;Reporting Summary(第 29 页)给出的是 402,786 + 100,636 = 503,422。论文未报告任何排除人数。p3, Fig. 1b: 7,426,036 tokens, records from 1934. The text's split sizes sum to 503,438 (402,799 + 100,639), 953 more than this figure; the Reporting Summary (p29) gives 402,786 + 100,636 = 503,422. No exclusion counts are reported. |
| 训练集(随机 80%)Training set (random 80%) | 402,799 | 第 2 页:2020-07-01 之前的记录。Reporting Summary(第 29 页)写的是 402,786 人、数据截至 2020-06-30。p2: records before 2020-07-01. The Reporting Summary (p29) instead states 402,786 individuals with data up to 2020-06-30. |
| 内部验证集(随机 20%;用于验证和超参数优化)Internal validation set (random 20%; validation and hyperparameter optimisation) | 100,639 | 第 2 页;图 5c 和 ED 图 10 的图注用的也是这个 n。Reporting Summary(第 29 页)写的是 100,636。p2; the same n appears in the Fig. 5c and ED Fig. 10 captions. The Reporting Summary (p29) states 100,636. |
| 验证集中 60 岁前后都有疾病记录的参与者(轨迹模拟实验)Validation participants with disease records both before and after age 60 (simulation experiment) | 63,662 | 第 4 页正文为 63,662;第 5 页图 3a 图注为 63,622。每人模拟一条轨迹。Text p4 says 63,662; the Fig. 3a caption (p5) says 63,622. One trajectory was simulated per person. |
| 纵向测试集(2020-07-01 仍在世的 UK Biobank 参与者)Longitudinal test set (UK Biobank participants alive on 2020-07-01) | 471,057 | 第 2 页:占全部参与者的 94%,取自整个队列而非验证集,随访至 2022-07-01。图 1b 标注的测试期为 2021–2023;Reporting Summary(第 29 页)称发病评估期为 2021-07-01 至 2022-07-01。相减可得 31,428 名(502,485 − 471,057)队列成员未纳入,论文未给出这个数。p2: 94% of participants, drawn from the whole cohort rather than from the validation set, followed up to 2022-07-01. Fig. 1b shows the testing window as 2021–2023; the Reporting Summary (p29) says incidence was evaluated from 2021-07-01 to 2022-07-01. By subtraction, 31,428 cohort members (502,485 − 471,057) were not included; the paper does not state this number. |
| 丹麦登记数据外部测试队列(沿用 UK Biobank 权重,未重新训练)Danish registry external test cohort (UK Biobank weights, no retraining) | 1,931,630 | 图 1b(第 3 页):11,512,665 个 token;输入期 1936–2016,纵向测试期 2016–2018。正文(第 2 页):“1.93 million Danish nationals”,时间跨度 1978–2018。Reporting Summary(第 29 页):仅限 2016-01-01 时 50–80 岁的人。正文没说评估了多少种疾病;图 5a 画出 438 个疾病点。Fig. 1b (p3): 11,512,665 tokens; input 1936–2016, longitudinal testing 2016–2018. Text (p2): '1.93 million Danish nationals', 1978–2018. Reporting Summary (p29): restricted to people aged 50–80 on 2016-01-01. The text does not say how many diseases were evaluated; Fig. 5a plots 438 disease points. |
全部发现(原文提取)All findings (from the paper) · 53
| R1 | 描述性Descriptive | 数据规模:词表共 1,258 个 token,模型输出 1,256 个疾病 token 加死亡的发生率。训练用了 402,799 名 UK Biobank 参与者。图 1b:UK Biobank 有 502,485 人、7,426,036 个 token;丹麦登记数据有 1,931,630 人、11,512,665 个 token。 Data scale: the vocabulary has 1,258 distinct tokens, and the model outputs rates for 1,256 disease tokens plus death. Training used 402,799 UK Biobank participants. Fig. 1b: UK Biobank has 502,485 individuals with 7,426,036 tokens; the Danish registries have 1,931,630 individuals with 11,512,665 tokens. | Fig. 1a,b p. 2–3 |
| R2 | 探索性Exploratory | 规模筛选:训练数据越多,验证损失越低;参数越多损失也越低,直到受数据量限制的最优点。对 UK Biobank,最优模型约 2 百万个参数(图 1e;全量数据下最低验证损失约 10.22,从图上读取)。全文使用的模型(Delphi-2M)嵌入维度 120、12 层、12 个注意力头,共 2.2 百万个参数。在 n = 486 个独立训练模型的筛选中(ED 图 2),嵌入维度对验证损失的随机森林重要性最高,层数和头数影响很小。未给出不确定性。 Scaling screen: validation loss fell with more training data, and with more parameters up to a data-limited optimum. For UK Biobank the best models had about 2 million parameters (Fig. 1e; with full data the minimum validation loss is about 10.22, read from the figure). The model used throughout (Delphi-2M) has embedding dimension 120, 12 layers and 12 heads, 2.2 million parameters in total. In the screen of n = 486 independently trained models (ED Fig. 2), embedding dimension had the highest random-forest importance for validation loss, while layers and heads mattered little. No uncertainty is given. | Fig. 1e; ED Fig. 2 p. 2–3, 16 |
| R3 | 敏感性分析Sensitivity | 其他参数设置得到的结果定性相似(ED 图 2;补充图 1 不在本 PDF 中)。Reporting Summary 称,用不同训练/验证划分重复训练的 4 个技术重复在疾病预测 AUC 上表现相近。这两点在 PDF 中都没有具体数字。 Other parameter choices gave qualitatively similar results (ED Fig. 2; Suppl. Fig. 1, not in this PDF). The Reporting Summary says 4 technical training replicates with different training/validation splits performed similarly in disease-prediction AUC. The PDF gives no numbers for either. | ED Fig. 2; Suppl. Fig. 1; Reporting Summary p. 2, 29 |
| R4 | 敏感性分析Sensitivity | “no event”填充 token 的插入频率(ED 图 1;每种频率 n = 3 次重复):填充越稀疏,疾病 token 上的验证交叉熵越高。每年 1 个填充 token 时约 4.87,每 5 年 1 个(论文采用的频率)时约 4.90,不加填充时约 4.98(从图上读取)。ED 图 1b 显示收益主要集中在约 30 岁以下。ED 图 1c 中,模型估计的填充频率与实际插入的频率一致。 'No event' padding rate (ED Fig. 1; n = 3 replicates per rate): validation cross-entropy on disease tokens rose steadily as padding became rarer. It was about 4.87 at 1 padding token per year, about 4.90 at 1 per 5 years (the rate used in the paper) and about 4.98 without padding (read from the figure). ED Fig. 1b shows the benefit concentrated below about age 30. In ED Fig. 1c, the padding rate estimated by the model tracks the rate actually inserted. | ED Fig. 1 p. 2, 15 |
| R5 | 次要结果Secondary | 消融实验(图 1f;补充表 1 和补充图 2 不在本 PDF 中):Delphi-2M 的改动使年龄–性别分层交叉熵优于标准 GPT(NanoGPT-2M)。从图上读取,数值为相对年龄–性别基线的 Δ交叉熵(越负越好):
- NanoGPT-2M:最小年龄段约 +1.1,约 32 岁时降到 0,40–80 岁约 −0.1 至 −0.2。
- Delphi-2M:40–80 岁约 −0.4 至 −0.55。
- 加了“no event”填充的 NanoGPT-2M:接近 Delphi-2M(原文称“好,但略逊”)。
- 去掉指数时间损失的 Delphi-2M:接近 Delphi-2M。
未显示不确定性。 Ablation (Fig. 1f; Suppl. Table 1 and Suppl. Fig. 2 are not in this PDF): Delphi-2M's changes gave better age- and sex-stratified cross-entropy than a standard GPT (NanoGPT-2M). Read from the figure as Δcross-entropy against an age–sex baseline (negative is better):
- NanoGPT-2M: about +1.1 at the youngest ages, crossing 0 near age 32, about −0.1 to −0.2 at ages 40–80.
- Delphi-2M: about −0.4 to −0.55 at ages 40–80.
- NanoGPT-2M with 'no event' padding: close to Delphi-2M ('good, albeit slightly inferior').
- Delphi-2M without the exponential time loss: close to Delphi-2M.
No uncertainty is shown. | Fig. 1f; Suppl. Table 1; Suppl. Fig. 2 p. 2–3 |
| R6 | 次要结果Secondary | 到下一事件的时间:Delphi-2M 输出绝对发生率,由此推出的等待时间平均与观察到的事件间隔一致。图 1g 中,按期望天数分箱后,观察到的平均天数沿对角线分布(约 60 到 2,000 天),但单个预测离散很大。未报告数值一致性指标。 Time to next event: Delphi-2M outputs absolute token rates whose implied waiting times match observed inter-event times on average. In Fig. 1g, the binned average of observed days to the next token follows the identity line against expected days (about 60 to 2,000 days), while individual predictions scatter widely. No numeric agreement statistic is reported. | Fig. 1g p. 2–3 |
| R7 | 描述性Descriptive | 在 10 个示例结局中(图 2a),个体预测发生率大体沿性别–年龄分层发病率曲线走,随新记录的输入在曲线上下浮动。个体预测在曲线周围的离散度,哮喘和关节病较窄,败血症和死亡较宽。未给出数字。 In 10 example outcomes (Fig. 2a), individual predicted rates largely follow the sex- and age-stratified incidence curves, moving above or below them as new inputs are recorded. Around the curve, the spread of individual predictions is narrow for asthma and arthrosis and wide for septicaemia and death. No numbers are given. | Fig. 2a p. 2, 4 |
| R8 | 主要结果Primary | 预测下一个诊断时,内部验证数据中年龄–性别分层 AUC 的平均值约为 0.76。评估对象是事件数足够的男性 n = 906、女性 n = 957 种诊断(图 2b;补充表 2 不在本 PDF 中)。平均值未给出置信区间。从图中核对:图 2b 画出 1,965 个点(图注人数合计为 1,863),均值 ≈ 0.758,中位数 ≈ 0.767。 For predicting the next diagnosis, the average age–sex-stratified AUC was approximately 0.76 in the internal validation data. It was evaluated for n = 906 diagnoses in men and n = 957 in women with enough events (Fig. 2b; Suppl. Table 2 is not in this PDF). No confidence interval is given for the average. Figure-derived check: Fig. 2b plots 1,965 points (the caption implies 1,863), with mean ≈ 0.758 and median ≈ 0.767. | Fig. 2b; Suppl. Table 2 p. 2, 4 |
| R9 | 主要结果Primary | 97% 的诊断 AUC 高于 0.5(未给出 CI)。从图中核对:图 2b 的 1,965 个点里有 1,899 个(96.6%)高于 0.5,66 个低于 0.5。这 66 个中有 59 个是出现次数不到 100 次的诊断,多属 ICD-10 第 II 章(肿瘤)、第 I 章(感染)和第 XVII 章(先天畸形)。 For 97% of diagnoses the AUC was above 0.5 (no CI given). Figure-derived check: 1,899 of the 1,965 points in Fig. 2b (96.6%) lie above 0.5 and 66 lie below. Of those 66, 59 are diagnoses with fewer than 100 occurrences, mostly from ICD-10 chapters II (neoplasms), I (infectious) and XVII (congenital abnormalities). | Fig. 2b p. 2, 4 |
| R10 | 亚组Subgroup | 各 ICD-10 章节和两种性别都表现出可预测性(图 2c,d)。从矢量图提取的各章节中位数,低端为 0.727(第 XI 章,消化系统)和 0.735(第 II 章,肿瘤),高端为 0.819(第 V 章,精神障碍)和 0.829(第 XV 章,妊娠与分娩)。男性和女性的中位数都是 0.767。0.025 分位数的下须,第 II 章约到 0.35,第 XVII 章约到 0.22。这些都是跨诊断的分布,未给出 CI。 Predictability held across ICD-10 chapters and both sexes (Fig. 2c,d). Chapter medians, extracted from the vector figure, range from 0.727 (XI, digestive) and 0.735 (II, neoplasms) to 0.819 (V, mental disorders) and 0.829 (XV, pregnancy and childbirth). The median is 0.767 for both men and women. The lower 0.025-quantile whisker reaches about 0.35 for chapter II and about 0.22 for chapter XVII. These are spreads across diagnoses; no CIs are given. | Fig. 2c,d p. 2, 4 |
| R11 | 主要结果Primary | 死亡是预测把握最高的下一事件之一,两种性别的年龄分层 AUC 都是 0.97(未给出 CI)。 Death was among the most confidently predicted next events, with an age-stratified AUC of 0.97 in both sexes (no CI given). | Fig. 2 (text) p. 2 |
| R12 | 次要结果Secondary | UK Biobank 验证数据中的校准:在 5 岁年龄段内,预测发生率与实际病例数吻合良好。ED 图 3a 按性别展示 9 种疾病和死亡,预测值按 10 的幂分箱。未报告校准斜率、截距或观察/期望比。 Calibration in UK Biobank validation data: within 5-year age brackets, predicted rates closely matched the observed number of cases. ED Fig. 3a shows 9 diseases and death by sex, with predictions binned by powers of 10. No calibration slope, intercept or observed/expected ratio is reported. | ED Fig. 3a p. 2–3, 17 |
| R13 | 主要结果Primary | 预测时间跨度:预测与诊断相隔 10 年时,平均 AUC 从 0.76 降到 0.70(图 2e;补充图 3)。图 2e 在 0、6、12、60、120 个月时的中位数(矢量提取)分别为 0.766、0.744、0.733、0.706、0.695。四分位距 0 个月时为 0.711–0.816,120 个月时为 0.645–0.746。这些是跨诊断的分布,未给出 CI。 Prediction horizon: the average AUC fell from 0.76 to 0.70 when the gap between prediction and diagnosis grew to 10 years (Fig. 2e; Suppl. Fig. 3). Fig. 2e medians (vector extraction) at 0, 6, 12, 60 and 120 months are 0.766, 0.744, 0.733, 0.706 and 0.695. The interquartile range is 0.711–0.816 at 0 months and 0.645–0.746 at 120 months. These spreads are across diagnoses; no CIs are given. | Fig. 2e; Suppl. Fig. 3 p. 3–4 |
| R14 | 次要结果Secondary | 纵向测试数据(2020-07-01 仍在世的 UK Biobank 参与者)的结果相近,随访期间诊断模式没有明显漂移(补充图 4 不在本 PDF 中)。外部验证一节给出的纵向测试平均 AUC 为 0.69(标准差 0.09)。 The longitudinal test data (UK Biobank participants alive on 2020-07-01) gave similar results, with no substantial shift in diagnostic patterns over follow-up (Suppl. Fig. 4, not in this PDF). The external validation section gives the longitudinal-test average AUC as 0.69 (s.d. 0.09). | Suppl. Fig. 4; Fig. 5a p. 3, 7 |
| R15 | 次要结果Secondary | 内部纵向测试集上死亡预测的对比(图 2f):Delphi AUC 0.81,另一 Transformer 0.78,Charlson 0.73,Elixhauser 0.71,Llama 3.1 0.69。未显示 CI 或显著性检验。 Benchmark for death on the internal longitudinal test set (Fig. 2f): Delphi AUC 0.81, a transformer 0.78, Charlson 0.73, Elixhauser 0.71, Llama 3.1 0.69. No CIs or significance tests are shown. | Fig. 2f p. 3–4 |
| R16 | 次要结果Secondary | 同一测试集上痴呆预测的对比(图 2f):Delphi AUC 0.82,UKBDRS 0.81,另一 Transformer 0.79,Llama 3.1 0.67。未显示 CI。 Benchmark for dementia on the same test set (Fig. 2f): Delphi AUC 0.82, UKBDRS 0.81, a transformer 0.79, Llama 3.1 0.67. No CIs are shown. | Fig. 2f p. 3–4 |
| R17 | 次要结果Secondary | 同一测试集上心血管病预测的对比(图 2f):QRISK3 AUC 0.71,Delphi 0.70,aPrevent 0.69,SCORE2 0.69,Framingham 0.69,另一 Transformer 0.69,AutoPrognosis 0.68,Llama 3.1 0.63。Delphi 低于 QRISK3。未显示 CI。 Benchmark for cardiovascular disease on the same test set (Fig. 2f): QRISK3 AUC 0.71, Delphi 0.70, aPrevent 0.69, SCORE2 0.69, Framingham 0.69, a transformer 0.69, AutoPrognosis 0.68, Llama 3.1 0.63. Delphi scored below QRISK3. No CIs are shown. | Fig. 2f p. 3–4 |
| R18 | 次要结果Secondary | 糖尿病:无论预测下一事件还是 24 个月以内的时间跨度,Delphi 都不如单用 HbA1c(正文;数字在补充图 4c 和补充表 3,不在本 PDF 中)。ED 图 4a(UK Biobank 验证集,基线招募时预测,5 年时间窗)中,糖尿病 AUC Delphi 为 0.75,HbA1c 为 0.84。未给出 CI。 Diabetes: Delphi did worse than HbA1c alone, both for next-event prediction and for horizons up to 24 months (text; numbers in Suppl. Fig. 4c and Suppl. Table 3, not in this PDF). In ED Fig. 4a (UK Biobank validation set, prediction at recruitment, 5-year window), the diabetes AUC was 0.75 for Delphi vs 0.84 for HbA1c. No CIs are given. | ED Fig. 4a; Suppl. Fig. 4c; Suppl. Table 3 p. 3, 18 |
| R19 | 次要结果Secondary | ED 图 4a 中的其他生物标志物对比(相同设置):贫血,Delphi AUC 0.78,血红蛋白 0.69,平均红细胞体积 0.56。慢性肝病,Delphi 0.70,多个临床指标的 logistic 回归 0.71。未给出 CI。 Other biomarker comparisons in ED Fig. 4a (same setting): for anaemia, Delphi AUC 0.78 vs 0.69 for haemoglobin and 0.56 for mean corpuscular volume. For chronic liver disease, Delphi 0.70 vs 0.71 for a logistic regression on several clinical markers. No CIs are given. | ED Fig. 4a p. 18 |
| R20 | 次要结果Secondary | 在 n = 410 种诊断上,Delphi-2M 的 AUC(UK Biobank 验证集)“总体高于”基于生物标志物的机器学习模型 MILTON(预后模式)(图 2g;正文此处引用的是图 2e 和 ED 图 4)。未给出汇总统计量。从图中核对:图 2g 共 795 个点,Delphi 较高的有 659 个(82.9%)。在 MILTON AUC 不低于 0.8 的 64 个点中,Delphi 较低的有 42 个。 For n = 410 diagnoses, Delphi-2M AUCs (UK Biobank validation set) were 'generally higher' than those of MILTON, a biomarker-based machine learning model used in prognostic mode (Fig. 2g; the text cites Fig. 2e and ED Fig. 4 here). No summary statistic is given. Figure-derived check: Fig. 2g plots 795 points, and Delphi is higher in 659 (82.9%). Among the 64 points where MILTON AUC is at least 0.8, Delphi is lower in 42. | Fig. 2g p. 3–4 |
| R21 | 次要结果Secondary | ED 图 4b 逐病比较了 Delphi 与自评总体健康(UK Biobank 字段 2178)预测招募后疾病的 AUC。多数疾病上 Delphi 更高(多数点位于对角线上方)。未给出汇总统计量。 ED Fig. 4b compares, across diseases, Delphi's AUC with the AUC of self-rated overall health (UK Biobank field 2178) as a predictor of disease after recruitment. Delphi is higher for most diseases (most points lie above the identity line). No summary statistic is given. | ED Fig. 4b p. 18 |
| R22 | 亚组Subgroup | ED 图 4c 按性别、ICD-10 章节以及饮酒、吸烟、BMI 的低/中/高分层拆分 AUC(男性 906 种、女性 957 种诊断)。目测各分层 AUC 大体相近。未做正式比较。 ED Fig. 4c splits AUCs by sex, ICD-10 chapter and low/mid/high strata of alcohol, smoking and BMI (n = 906 diagnoses in men, 957 in women). By visual reading, the AUCs are broadly similar across strata. No formal comparison is shown. | ED Fig. 4c p. 18 |
| R23 | 探索性Exploratory | ED 图 5 用招募前的数据预测 10 个选定结局的 5 年内发病,展示 40–80 岁各 5 岁年龄组的平均验证 AUC。仅用 Delphi 时的 AUC(从柱状图读取):
- 约 0.50:乳腺癌(C50)
- 约 0.52:抑郁发作(F32)和哮喘(J45)
- 约 0.66:急性心肌梗死(I21)
- 约 0.70:阿尔茨海默病(G30)
- 约 0.72:胰腺癌(C25)
- 约 0.74:死亡
- 约 0.79–0.80:水痘(B01)、败血症(A41)和 1 型糖尿病(E10)
柱子没有数值标注,也没有 CI。 ED Fig. 5 predicts 5-year disease occurrence from data before recruitment, for 10 selected outcomes. It shows the average validation AUC over 5-year age groups from 40 to 80. Delphi-alone AUCs, read from the bars:
- about 0.50: breast cancer (C50)
- about 0.52: depressive episode (F32) and asthma (J45)
- about 0.66: acute myocardial infarction (I21)
- about 0.70: Alzheimer's disease (G30)
- about 0.72: pancreatic cancer (C25)
- about 0.74: death
- about 0.79–0.80: varicella (B01), septicaemia (A41) and type 1 diabetes (E10)
The bars have no numeric labels or CIs. | ED Fig. 5 p. 19 |
| R24 | 探索性Exploratory | 在 Delphi logits 上叠加其他数据(ED 图 5;从柱状图读取;无 CI):
- 多基因风险评分(PRS):1 型糖尿病约 0.80 → 0.84;急性心梗约 0.66 → 0.70;乳腺癌约 0.50 → 0.62,与单用 PRS(约 0.62)相同。
- 57 项生物标志物:1 型糖尿病约 0.93(单用生物标志物约 0.91);胰腺癌约 0.76;急性心梗约 0.74。阿尔茨海默病(约 0.68 对 0.70)和水痘(约 0.77 对 0.79)的组合模型反而低于单用 Delphi。
- 自评健康:抑郁发作约 0.66(单用自评健康约 0.65);哮喘约 0.64。 Adding other data to Delphi logits (ED Fig. 5; read from the bars; no CIs):
- Polygenic risk scores (PRS): type 1 diabetes about 0.80 → 0.84; AMI about 0.66 → 0.70; breast cancer about 0.50 → 0.62, which equals PRS alone (about 0.62).
- 57 biomarkers: type 1 diabetes about 0.93 (biomarkers alone about 0.91); pancreatic cancer about 0.76; AMI about 0.74. For Alzheimer's disease (about 0.68 vs 0.70) and varicella (about 0.77 vs 0.79), the combined model scored below Delphi alone.
- Self-rated health: depressive episode about 0.66 (health rating alone about 0.65); asthma about 0.64. | ED Fig. 5a–c p. 19 |
| R25 | 次要结果Secondary | 对 60 岁前后都有记录的验证集参与者,从 60 岁开始模拟轨迹:正文 n = 63,662,图 3a 图注 n = 63,622,每人一条。70–75 岁的人群疾病发生率“被很好地重现”:图 3b 中各病的模拟与观察发生率沿对角线分布,范围约 10^-5 到 10^-1 每年。未报告一致性统计量。 Trajectories were simulated from age 60 for validation participants with records both before and after 60: n = 63,662 in the text, n = 63,622 in the Fig. 3a caption, one trajectory per person. Population disease rates at ages 70–75 were 'well recapitulated': in Fig. 3b, simulated and observed per-disease rates lie along the identity line from about 10^-5 to 10^-1 per year. No agreement statistic is reported. | Fig. 3a,b p. 4–5 |
| R26 | 次要结果Secondary | 采样轨迹的交叉熵损失平均与观察数据无法区分;把参与者之间的既往病史打乱后,该指标“下降”(原文用词)(补充图 5b 不在本 PDF 中)。未给出数字。 The cross-entropy loss of sampled trajectories was, on average, indistinguishable from that of observed data, and it 'drops' (text wording) when preceding disease histories are shuffled between participants (Suppl. Fig. 5b, not in this PDF). No numbers are given. | Suppl. Fig. 5b p. 5 |
| R27 | 主要结果Primary | 预测正确的疾病 token 比例(图 3c):模拟第一年约 17%,20 年后降到 14% 以下;只用年龄和性别的基线为 12–13%(补充图 5c,d)。矢量图提取值:Delphi-2M 第 0–1 年 0.173,第 3–4 年 0.155,第 10–11 年 0.151,第 18–19 年 0.136。基线在 0.118 到 0.129 之间。未给出不确定性。 Fraction of correctly predicted disease tokens (Fig. 3c): about 17% in the first simulated year, falling below 14% after 20 years, vs 12–13% for an age- and sex-only baseline (Suppl. Fig. 5c,d). Values from the vector figure: Delphi-2M 0.173 in year 0–1, 0.155 in year 3–4, 0.151 in year 10–11 and 0.136 in year 18–19. The baseline runs from 0.118 to 0.129. No uncertainty is given. | Fig. 3c; Suppl. Fig. 5c,d p. 5 |
| R28 | 亚组Subgroup | 吸烟、饮酒、BMI 高低组之间疾病负担的差异(70–75 岁,从 60 岁开始模拟)“预测得很好”(图 3d;ED 图 6a)。这些面板未报告相关系数或误差指标。ED 图 6a 的分组人数:
- 吸烟:低 n = 55,827,高 n = 4,458
- 饮酒:低 n = 19,108,高 n = 13,610
- BMI:低 n = 4,853,高 n = 25,216 Changes in disease burden between high and low smoking, alcohol and BMI groups (ages 70–75, simulated from age 60) were 'well predicted' (Fig. 3d; ED Fig. 6a). No correlation or error metric is reported for these panels. Group sizes in ED Fig. 6a:
- smoking: low n = 55,827, high n = 4,458
- alcohol: low n = 19,108, high n = 13,610
- BMI: low n = 4,853, high n = 25,216 | Fig. 3d; ED Fig. 6a p. 5, 20–21 |
| R29 | 亚组Subgroup | 有/无既往疾病的分组(ED 图 6b,c)被描述为“结果相似”。模型与观察的倍数变化之间的 Pearson 相关:
- 乳腺癌(C50):r = 0.34(患病组 n = 3,558)
- 抑郁发作(F32):r = 0.49(n = 14,148)
- 急性心梗(I21):r = 0.67(n = 5,013)
- 哮喘(J45):r = 0.36(n = 20,040)
- 1 型糖尿病(E10):无法计算,“nan(观测不足)”(n = 834)
未给出 CI 或 P 值。 Groups with vs without a prior disease (ED Fig. 6b,c) were described as showing 'similar findings'. Pearson correlations between modelled and observed fold changes:
- breast cancer (C50): r = 0.34 (n with the disease = 3,558)
- depressive episode (F32): r = 0.49 (n = 14,148)
- acute myocardial infarction (I21): r = 0.67 (n = 5,013)
- asthma (J45): r = 0.36 (n = 20,040)
- type 1 diabetes (E10): not computable, 'nan (insufficient observations)' (n = 834)
No CIs or P values are given. | ED Fig. 6b,c p. 5, 20–21 |
| R30 | 亚组Subgroup | 风险分层(ED 图 6d):按 60 岁时的风险把模拟轨迹分成前 1%、5–99% 和后 5% 三组。图中并列展示 9 种疾病和死亡的模拟与观察累积发病曲线,图注称 Delphi“准确分层”。未报告数值一致性指标。 Risk stratification (ED Fig. 6d): simulated trajectories were split into top-1%, 5–99% and bottom-5% risk groups at age 60. Simulated and observed cumulative incidence curves are shown side by side for 9 diseases and death, and the caption says Delphi 'accurately stratifies' them. No numeric concordance measure is reported. | ED Fig. 6d p. 5, 20–21 |
| R31 | 次要结果Secondary | 从出生开始、随机指定性别采样出的完全合成轨迹,重现了观察到的年龄–性别别发病率(图 3e:70–75 岁模拟与观察发生率沿对角线分布)。生成轨迹与训练数据的相似度并不高于与验证集的相似度(补充图 6 不在本 PDF 中)。PDF 中没有给出相似度或隐私的数值指标。 Fully synthetic trajectories, sampled from birth with randomly assigned sex, reproduced the observed age- and sex-specific incidence (Fig. 3e: simulated vs observed rates at ages 70–75 lie along the identity line). Generated trajectories were no more similar to the training data than to the validation cohort (Suppl. Fig. 6, not in this PDF). The PDF gives no numeric similarity or privacy metric. | Fig. 3e; Suppl. Fig. 6 p. 5 |
| R32 | 次要结果Secondary | 仅用合成数据训练的 Delphi-2M 在真实验证数据上的年龄–性别分层平均 AUC 为 0.74,比原模型低 3 个百分点(图 3f;n = 1,334 个疾病–性别组合)。图 3f 矢量提取值,UKB 训练 vs 合成数据训练:
- 中位数:0.763 vs 0.736
- 四分位距:0.702–0.821 vs 0.677–0.797
- 0.025–0.975 分位数:0.583–0.959 vs 0.551–0.937
这些是跨疾病–性别组合的分布,两者之差没有 CI。 A Delphi-2M version trained only on synthetic data reached an age–sex-stratified average AUC of 0.74 on real validation data, 3 percentage points below the original model (Fig. 3f; n = 1,334 disease–sex pairs). Fig. 3f values (vector extraction), UKB-trained vs synthetic-trained:
- median: 0.763 vs 0.736
- IQR: 0.702–0.821 vs 0.677–0.797
- 0.025–0.975 quantiles: 0.583–0.959 vs 0.551–0.937
These spreads are across disease–sex pairs; the difference has no CI. | Fig. 3f p. 5 |
| R33 | 探索性Exploratory | 在 token 嵌入矩阵的 UMAP 图中(图 4a),疾病编码大多按 ICD-10 章节聚集,而模型并未获得章节信息。文中指出的例外:女性生殖道的癌和癌前病变聚在一起,两型糖尿病与视网膜病变、神经病变聚在一起。急性死亡率高的疾病(心肌梗死、败血症)与死亡聚在一起。未报告量化的聚类指标。 In a UMAP of the token embedding matrix (Fig. 4a), disease codes cluster mostly by ICD-10 chapter, information the model was not given. Noted exceptions: cancers and precancers of the female reproductive tract group together, and both types of diabetes group with retinal disorders and neuropathies. High-acute-mortality diseases (myocardial infarction, septicaemia) cluster with death. No quantitative clustering measure is reported. | Fig. 4a; ED Fig. 8a p. 5–6, 23 |
| R34 | 探索性Exploratory | 单人 SHAP 示例(图 4b 上):确诊前一刻,胰腺癌发生率是基线的 19.0 倍。各项贡献:
- K30 消化不良(62.8 岁):×4.16
- K83 其他胆道疾病(51.4 岁):×2.22
- K86 其他胰腺疾病(51.4 岁):×2.08
- E11 2 型糖尿病(51.5 岁):×1.88
- K76 其他肝病(59.4 岁):×1.85
- N19 肾衰竭(51.4 岁):×0.64
- 其余 29 个特征:×0.43
图注写的是 68.2 岁时的预测,但面板中胰腺癌(C25)的确诊年龄为 62.8 岁。 Single-person SHAP example (Fig. 4b, top): just before diagnosis, the pancreatic cancer rate was 19.0 times the baseline. Contributions:
- K30 dyspepsia (62.8 y): ×4.16
- K83 other diseases of biliary tract (51.4 y): ×2.22
- K86 other diseases of pancreas (51.4 y): ×2.08
- E11 type 2 diabetes (51.5 y): ×1.88
- K76 other liver disease (59.4 y): ×1.85
- N19 renal failure (51.4 y): ×0.64
- 29 other features: ×0.43
The caption dates this prediction to age 68.2 years, but the panels place the pancreatic cancer diagnosis (C25) at 62.8 years. | Fig. 4b p. 6 |
| R35 | 探索性Exploratory | 同一人 63.5 岁时的死亡率(图 4b 下):相对基线为 9.3 × 10^4 倍。各项贡献:
- C25 胰腺癌(62.8 岁):×168.26
- 其余 34 个特征:×6.50
- J18 肺炎(63.5 岁):×4.60
- I80 静脉炎(63.5 岁):×3.29
- 男性:×2.11
- D64 其他贫血(63.4 岁):×1.79
- E14 未特指糖尿病(44.5 岁):×1.49
正文说胰腺癌确诊使死亡率升高“近一万倍”,但图中该 token 的贡献为 ×168.26,总计为 9.3 × 10^4。正文与图不一致。 Same person, mortality at 63.5 years (Fig. 4b, bottom): relative rate 9.3 × 10^4 vs baseline. Contributions:
- C25 pancreatic cancer (62.8 y): ×168.26
- 34 other features: ×6.50
- J18 pneumonia (63.5 y): ×4.60
- I80 phlebitis (63.5 y): ×3.29
- male sex: ×2.11
- D64 other anaemias (63.4 y): ×1.79
- E14 unspecified diabetes (44.5 y): ×1.49
The text says the pancreatic cancer diagnosis raised mortality 'almost ten thousandfold', but the figure shows ×168.26 for that token and 9.3 × 10^4 in total. Text and figure do not agree. | Fig. 4b p. 6 |
| R36 | 探索性Exploratory | 对 100,639 名验证集个体做 SHAP,得到逐 token 的发生率变化矩阵(图 4c 左;n = 778 个出现 5 次以上的疾病 token)。效应大多是提高其他疾病的发生率,且多集中在同一 ICD-10 章节内,第 V 章(精神障碍)和第 XV 章(妊娠与分娩)整章成块。疾病两两之间的效应常呈对称(补充图 7)。嵌入空间中相近的疾病彼此影响更大(ED 图 8)。未给出数值汇总。Reporting Summary 给出的评估门槛不同:记录超过 25 条的疾病。 SHAP across 100,639 validation individuals gave a token-by-token matrix of rate changes (Fig. 4c, left; n = 778 disease tokens with more than 5 occurrences). Effects mostly raised the rates of other diseases and clustered within the same ICD-10 chapter, with chapter-wide blocks for V (mental disorders) and XV (pregnancy and childbirth). Effects were often symmetric between pairs of diseases (Suppl. Fig. 7). Diseases close in embedding space influenced each other more (ED Fig. 8). No numeric summary is given. The Reporting Summary gives a different evaluation threshold: diseases with more than 25 entries. | Fig. 4c; ED Fig. 8; Suppl. Fig. 7 p. 6–7, 23, 29 |
| R37 | 探索性Exploratory | 对 10 种选定疾病(ED 图 7),正则化 Cox 比例风险模型的非零系数被描述为与平均 SHAP 值高度相关。未给出相关系数,且许多 Cox 系数被压缩为零。 For 10 selected diseases (ED Fig. 7), the non-zero coefficients of a regularised Cox proportional hazards model were described as highly correlated with averaged SHAP values. No correlation coefficient is given, and many Cox coefficients were shrunk to zero. | ED Fig. 7 p. 6–7, 22 |
| R38 | 探索性Exploratory | 10 年后的影响(图 4c 右)模式与短期效应相似,但强度大幅减弱。5 年内可见的第 XV 章(妊娠与分娩)聚类在 10 年时消失。精神障碍之间的依赖以及肿瘤对死亡率的影响仍然可见。未给出数字。 Influences 10 years out (Fig. 4c, right) followed patterns similar to short-term effects but were greatly attenuated. The chapter XV (pregnancy and childbirth) cluster seen within 5 years was absent at 10 years. Dependencies among mental disorders and the effects of neoplasms on mortality remained visible. No numbers are given. | Fig. 4c p. 6–7 |
| R39 | 探索性Exploratory | 确诊后死亡率效应随时间的变化(图 4d;从对数坐标趋势线读取;无 CI):
- 乳腺癌(C50):确诊时约 10 倍,10 年时约 9 倍。
- 胰腺癌(C25):前 3 年高于 100 倍,6 年时约 35 倍,10 年时约 17 倍。
- 败血症(A41):确诊时约 5 倍,3 年时约 1.9 倍,10 年时约 1.3 倍。
- 抑郁发作(F32):确诊时约 2 倍,之后约 1.5 倍。
正文称癌症效应以数年的半衰期衰减,败血症效应短暂,并称与 Nelson–Aalen 风险估计和注意力图一致(补充图 8 不在本 PDF 中)。 Mortality effect over time since diagnosis (Fig. 4d; trend lines read from the log scale; no CIs):
- Breast cancer (C50): about 10-fold at diagnosis, about 9-fold at 10 years.
- Pancreatic cancer (C25): above 100-fold in the first 3 years, about 35-fold at 6 years, about 17-fold at 10 years.
- Septicaemia (A41): about 5-fold at diagnosis, about 1.9-fold at 3 years, about 1.3-fold at 10 years.
- Depressive episode (F32): about 2-fold at diagnosis, about 1.5-fold afterwards.
The text describes cancer effects as decaying with a half-life of several years and septicaemia effects as short-lived. It reports agreement with Nelson–Aalen hazard estimates and attention maps (Suppl. Fig. 8, not in this PDF). | Fig. 4d; Suppl. Fig. 8 p. 6–7 |
| R40 | 主要结果Primary | 在丹麦登记数据上做外部测试,直接使用 UK Biobank 权重,未重新训练或调整:平均 AUC 0.67(标准差 0.09),UK Biobank 纵向测试为 0.69(标准差 0.09)。标准差是跨疾病计算的。平均值没有 CI,也没有对差异做检验,正文未说明比较了多少种疾病。从图中核对:图 5a 画出 438 种疾病,丹麦平均 AUC 0.687,UK Biobank 0.696。438 个点中有 259 个在对角线上方(UK Biobank 更高)。这个图上算出的丹麦均值高于报告的 0.67。 External test on Danish registry data, using the UK Biobank weights with no retraining or adjustment: average AUC 0.67 (s.d. 0.09), vs 0.69 (s.d. 0.09) for UK Biobank longitudinal testing. The s.d. is across diseases. No CI for the averages and no test of the difference are given, and the text does not say how many diseases were compared. Figure-derived check: Fig. 5a plots 438 diseases, with mean AUC 0.687 in Denmark and 0.696 in UK Biobank. 259 of the 438 lie above the identity line (higher in UK Biobank). This plotted Danish mean is higher than the reported 0.67. | Fig. 5a; Suppl. Fig. 9 p. 7 |
| R41 | 主要结果Primary | 两个数据集之间逐病 AUC 相关:Pearson r = 0.76(95% CI 0.72–0.80)(图 5a;补充图 9)。从图中核对:438 个点算得 r ≈ 0.75,与报告一致。 Per-disease AUCs were correlated between the two datasets: Pearson r = 0.76 (95% CI 0.72–0.80) (Fig. 5a; Suppl. Fig. 9). Figure-derived check: the 438 plotted points give r ≈ 0.75, consistent with this. | Fig. 5a; Suppl. Fig. 9 p. 7 |
| R42 | 次要结果Secondary | 丹麦纵向测试数据的分位数校准(ED 图 3b;每条线为一种 ICD-10 疾病,按章节分组):各线走向与对角线一致,但离散度明显大于 ED 图 3a 中的 UK Biobank 曲线。死亡一项在整个绘图范围内观察发生率都高于模型发生率;在最低分位约高 70 倍,只在最高预测值处才与对角线相交(对数坐标目测)。正文没有讨论这个面板,也未给出数值校准指标。 Calibration in the Danish longitudinal test data, by decile (ED Fig. 3b; one line per ICD-10 disease, grouped by chapter): the lines follow the direction of the identity line but scatter more widely than the UK Biobank curves in ED Fig. 3a. For death, the observed rate is above the model rate across the plotted range; at the lowest decile it is roughly 70 times higher, and the two meet only at the highest predicted rates (visual reading of a log-scale plot). The text does not discuss this panel, and no numeric calibration metric is given. | ED Fig. 3b p. 17 |
| R43 | 亚组Subgroup | Delphi-2M 重现了白人参与者疾病率较低、疾病率随剥夺程度升高的趋势。正文引用的是 ED 图 9,但本 PDF 中这些面板位于 ED 图 10a–d(ED 图 9 展示的是 token 来源偏倚)。验证集分组人数(ED 图 10e,f):
- 种族:亚裔 n = 1,907,黑人 n = 1,550,华人 n = 297,混血 n = 598,白人 n = 94,552
- 剥夺程度 1–5 组:n = 42,663、29,612、10,103、3,515、755
更多亚组分析见补充讨论、补充图 10–11 和补充表 4(不在本 PDF 中)。 Delphi-2M reproduced lower disease rates among White participants and rates rising with deprivation. The text cites ED Fig. 9, but in this PDF those panels are ED Fig. 10a–d (ED Fig. 9 shows token-source biases). Validation-cohort group sizes (ED Fig. 10e,f):
- ethnicity: Asian n = 1,907, Black n = 1,550, Chinese n = 297, Mixed n = 598, White n = 94,552
- deprivation groups 1–5: n = 42,663, 29,612, 10,103, 3,515, 755
More subgroup analyses are in the Supplementary Discussion, Suppl. Figs. 10–11 and Suppl. Table 4 (not in this PDF). | ED Fig. 10a–d (cited in text as ED Fig. 9) p. 8, 26 |
| R44 | 亚组Subgroup | 10 种疾病按种族的年龄–性别分层 AUC(ED 图 10e)。DeLong 95% CI 以误差线表示,没有数值标注;以下数值从柱状图读取:
- 死亡:白人约 0.95,亚裔约 0.95,黑人约 0.89,混血约 0.86。
- 抑郁发作:白人约 0.69,华人约 0.50。
- 乳腺癌:白人约 0.65,亚裔和混血各约 0.55。
水痘和胰腺癌只有白人的估计值。小样本组的区间很宽。 Age–sex-stratified AUC by ethnicity for 10 diseases (ED Fig. 10e). DeLong 95% CIs appear as error bars without numeric labels; values are read from the bars:
- Death: White about 0.95, Asian about 0.95, Black about 0.89, Mixed about 0.86.
- Depressive episode: White about 0.69, Chinese about 0.50.
- Breast cancer: White about 0.65; Asian and Mixed about 0.55 each.
Varicella and pancreatic cancer have estimates only for White participants. Intervals for the small groups are wide. | ED Fig. 10e p. 26 |
| R45 | 亚组Subgroup | 按剥夺程度分组(ED 图 10f;从柱状图读取),各组 AUC 大体相近:死亡各组均约 0.94,乳腺癌约 0.57–0.66,哮喘约 0.60–0.65。胰腺癌只有 1–3 组有估计值(约 0.80–0.87)。柱子没有数值标注。 By deprivation group (ED Fig. 10f; read from the bars), AUCs were broadly similar: death about 0.94 in every group, breast cancer about 0.57–0.66, asthma about 0.60–0.65. Pancreatic cancer has estimates only for groups 1–3 (about 0.80–0.87). The bars have no numeric labels. | ED Fig. 10f p. 26 |
| R46 | 亚组Subgroup | 异质性与样本量(ED 图 10g–i):各分层之间 AUC 的标准差最高约 0.25,token 越少的疾病越大。AUC 95% CI 宽度随病例数增加而变窄:病例最少(不足 10 例)的疾病局部平均约 0.4,约 100 例时约 0.1。PDF 中没有正式异质性检验的结果。 Heterogeneity vs sample size (ED Fig. 10g–i): the standard deviation of AUC between strata reached about 0.25 and was larger for diseases with fewer tokens. AUC 95% CI width shrank as case numbers grew: the local average is about 0.4 for diseases with the fewest cases (under 10) and about 0.1 at around 100 cases. The PDF reports no result of a formal heterogeneity test. | ED Fig. 10g–i p. 26 |
| R47 | 亚组Subgroup | 出生队列(ED 图 10j):1960 年后出生与 1944 年前出生者之间的 ΔAUC,在每个 ICD-10 章节都以 0 附近为中心(男性 906 种、女性 957 种诊断)。第 XV 章离散最大,约 −0.6 到 +0.7(从图上读取)。未给出检验结果。 Birth cohort (ED Fig. 10j): ΔAUC between participants born after 1960 and before 1944 was centred near 0 in every ICD-10 chapter (n = 906 diagnoses in men, 957 in women). Chapter XV showed the widest spread, about −0.6 to +0.7 (read from the figure). No test result is given. | ED Fig. 10j p. 26 |
| R48 | 描述性Descriptive | UK Biobank 参与者大多在 40–70 岁招募,招募前的死亡不会被记录(选择偏倚/永生时间偏倚)。图 5b 中,Delphi-2M 的年死亡率与 UK Biobank 观察值一致。两者在较年轻年龄段都远低于英国国家统计局(ONS,2017–2019)的全国死亡率,大约到 75–80 岁才与之重合(从图上读取)。 Most UK Biobank participants were recruited at ages 40–70, so no deaths were recorded before recruitment (selection or immortal-time bias). In Fig. 5b, Delphi-2M's yearly mortality follows the observed UK Biobank rates. Both lie far below the Office for National Statistics national rates (2017–2019) at younger ages and meet them only around age 75–80 (read from the figure). | Fig. 5b p. 7–8 |
| R49 | 描述性Descriptive | 80 岁及以上人群的随访数据有限,这一年龄段无法可靠建模。图 5b 把 80 岁以上标为观测不足、Delphi-2M 不建模。 Follow-up data are limited for people aged 80 and over, so this period is not reliably modelled. Fig. 5b marks ages above 80 as having insufficient observations and not modelled by Delphi-2M. | Fig. 5b p. 7–8 |
| R50 | 描述性Descriptive | 疾病记录来自自报、初级保健、住院、癌症登记和死亡登记。自报和全科医生记录多为常见病,住院记录则包含更凶险的 token,如心肌梗死和败血症(图 5d)。并非每位参与者、每个时段都有全部来源(图 5c;补充图 12)。图 5c 验证集(n = 100,639)的 UpSet 柱,从图上读取:
- 住院 + 自报:约 35%
- 住院 + 自报 + 初级保健:约 26%
- 仅住院:约 11%
- 住院 + 初级保健:约 9%
- 仅自报:约 6%
- 自报 + 初级保健:约 5%
- 仅初级保健:约 3.5%
合计约 45% 的参与者有来自初级保健的疾病 token。 Disease records came from self-report, primary care, hospital admissions, cancer registries and death registries. Self-report and GP records hold mostly common diseases, while hospital records hold more aggressive tokens such as myocardial infarction and septicaemia (Fig. 5d). Not every source was available for every participant and period (Fig. 5c; Suppl. Fig. 12). Fig. 5c UpSet bars for the validation cohort (n = 100,639), read from the figure:
- hospital + self-report: about 35%
- hospital + self-report + primary care: about 26%
- hospital only: about 11%
- hospital + primary care: about 9%
- self-report only: about 6%
- self-report + primary care: about 5%
- primary care only: about 3.5%
Summed, about 45% of participants have any primary-care-derived disease token. | Fig. 5c,d; Suppl. Fig. 12 p. 7–8 |
| R51 | 次要结果Secondary | Delphi-2M 学到了数据来源缺失造成的模式。只在住院记录中出现的疾病,在病史中有其他住院记录的人身上,预测发生率平均高出十倍(图 5e,f)。图 5e 中 loess 趋势从住院特异度为 0 时的约 1 倍升到 1.0 时的约 10 倍。图 5f 中初级保健的趋势从约 0.8 倍升到约 3 倍。“十倍”没有 CI;loess 曲线带有 95% CI 带。 Delphi-2M learned patterns created by missing data sources. Predicted rates of diseases recorded only in hospital were on average ten times higher in people whose history included other hospital records (Fig. 5e,f). In Fig. 5e, the loess trend rises from about 1-fold at hospital-record specificity 0 to about 10-fold at 1.0. In Fig. 5f, the primary-care trend rises from about 0.8-fold to about 3-fold. The ten-fold figure has no CI; the loess curves carry 95% CI bands. | Fig. 5e,f p. 7–8 |
| R52 | 次要结果Secondary | 败血症:93% 的病例在医院确诊;有任何其他住院数据的人,其预测发生率高出 8 倍。未给出 CI。 Septicaemia: 93% of cases were diagnosed in hospital, and its predicted rate was 8 times higher in people with any other hospital data. No CI is given. | Fig. 5e (text) p. 8 |
| R53 | 探索性Exploratory | 数据来源效应也解释了嵌入 UMAP 和 SHAP 矩阵中的部分子结构。图 5g 按主导来源(超过 65% 的记录)对疾病分组,同一来源组内的 SHAP 效应更强。给模型加入按来源区分的 token 后,嵌入按来源分开(ED 图 9a–d;正文引用为 ED 图 10a–d)。未给出量化指标。 Data-source effects also explain part of the substructure in the embedding UMAP and the SHAP matrices. In Fig. 5g, diseases are grouped by dominating source (more than 65% of records), and SHAP effects are stronger within the same source group. In a model given explicit source-specific tokens, the embedding separates by source (ED Fig. 9a–d; the text cites ED Fig. 10a–d). No quantitative measure is given. | Fig. 5g; ED Fig. 9 (cited in text as ED Fig. 10) p. 7–8, 24–25 |
研究局限Limitations
研究设计Study design · 2
- p. 7–8健康志愿者及入组选择偏倚限制了人群代表性。Healthy-volunteer and recruitment selection biases limit representativeness.
- p. 7, 10–11入组前缺少死亡记录,可能扭曲死亡风险估计。Missing pre-recruitment deaths can distort mortality estimates.
数据Data · 2
- p. 780 岁以上的随访不足,难以支持高龄人群应用。Limited follow-up above age 80 restricts use in older populations.
- p. 7–8诊断数据来源与覆盖差异可能形成预测伪影。Differences in diagnostic sources and coverage can create prediction artefacts.
外推性Generalizability · 1
- p. 7–8不同祖源与社会经济群体间的预测表现可能不一致。Performance may vary across ancestry and socioeconomic groups.
解读Interpretation · 2
- p. 8个体未来轨迹具有较大的偶然性,不能当作确定预后。Individual future trajectories remain uncertain and should not be treated as definite prognoses.
- p. 8疾病之间的预测关联不等于因果关系。Predictive associations between diseases do not establish causation.
其他Other · 1
- p. 9临床部署仍需监管框架及进一步验证。Clinical deployment still requires regulatory oversight and further validation.
我的思考My thoughts
整体评价Overall assessment
这项研究展示了用生成式模型学习多病轨迹的可行性,也做了时间外推和外部验证。但排序表现不等于风险估计准确;目前更适合作为研究方法的起点,而非直接用于个体临床决策。
The study demonstrates a workable generative approach to disease trajectories, with temporal and external validation. Good risk ranking does not guarantee accurate absolute risk, however. I would treat it as a starting point for research rather than a ready-to-use clinical decision tool.
我认为还可能存在的不足Further limitations I see
- p. 2, 10, 16内部评估与模型开发并非完全独立,表现可能偏乐观。Internal evaluation is not fully independent of model development, so performance may be optimistic.
- p. 10只保留首次诊断和粗略的生活方式记录,难以反映复发与病程变化。First diagnoses and coarse lifestyle records miss recurrence and changes over time.
- p. 7, 17跨医疗体系的校准仍不充分;AUC 尚可,也可能高估或低估绝对风险。Calibration across healthcare systems remains insufficiently established; acceptable AUC can coexist with over- or underestimated absolute risk.
优先考虑的改进Most feasible improvement
- 优先用一份独立的本地数据检查少数目标结局的校准:比较预测与实际发生率,报告校准截距和斜率;若偏差明显,先尝试简单再校准,再决定是否需要重训。Start with a calibration check for a few target outcomes in independent local data: compare predicted and observed rates and report calibration intercepts and slopes. If there is systematic bias, try simple recalibration before considering model retraining.
应用Applications
- 临床文本与语音:把非结构化记录整理成事件时间线。Clinical text and speech: turn unstructured records into event timelines.先在小样本中人工核对事件、诊断编码和日期抽取,再考虑接入序列模型。First manually check event, code, and date extraction in a small sample before using the timelines in a sequence model.
- 设备与可穿戴数据:研究带时间的低氧或报警事件序列。Device and wearable data: study timed sequences of hypoxia or alarm events.先做好信号质量控制,再提取事件;是否能预测后续事件,需要单独验证。Quality-check the signals before extracting events, then separately test whether the sequences help predict later events.
- 卫生服务规划:探索人群层面的疾病负担和服务需求。Health-service planning: explore population-level disease burden and service demand.用本地发生率校准,并与历史趋势比较;不将人群模拟解释为个人命运。Calibrate to local rates and compare with historical trends; population simulations are not individual forecasts.